Error processing SSI file
Weekly Report: Influenza Summary Update
2008-2009 Influenza Season Week 15 ending April 18, 2009
(All data are preliminary and may change as more reports are received.)Synopsis:
During week 15 (April 12-18, 2009), influenza activity continued to decrease in the United States.
- One hundred fifty-one (6.2%) specimens tested by U.S. World Health Organization (WHO) and National Respiratory and Enteric Virus Surveillance System (NREVSS) collaborating laboratories and reported to CDC/Influenza Division were positive for influenza.
- The proportion of deaths attributed to pneumonia and influenza (P&I) was below the epidemic threshold.
- Two influenza-associated pediatric deaths were reported.
- The proportion of outpatient visits for influenza-like illness (ILI) was below national and region-specific baseline levels.
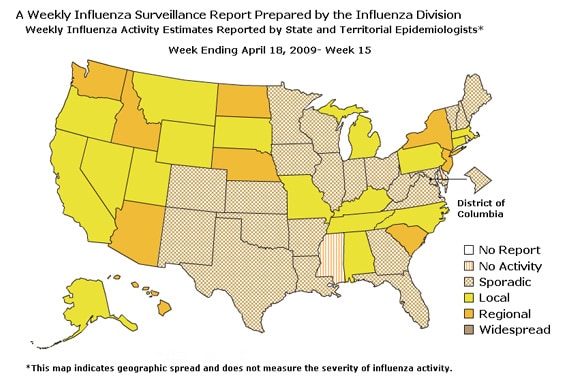
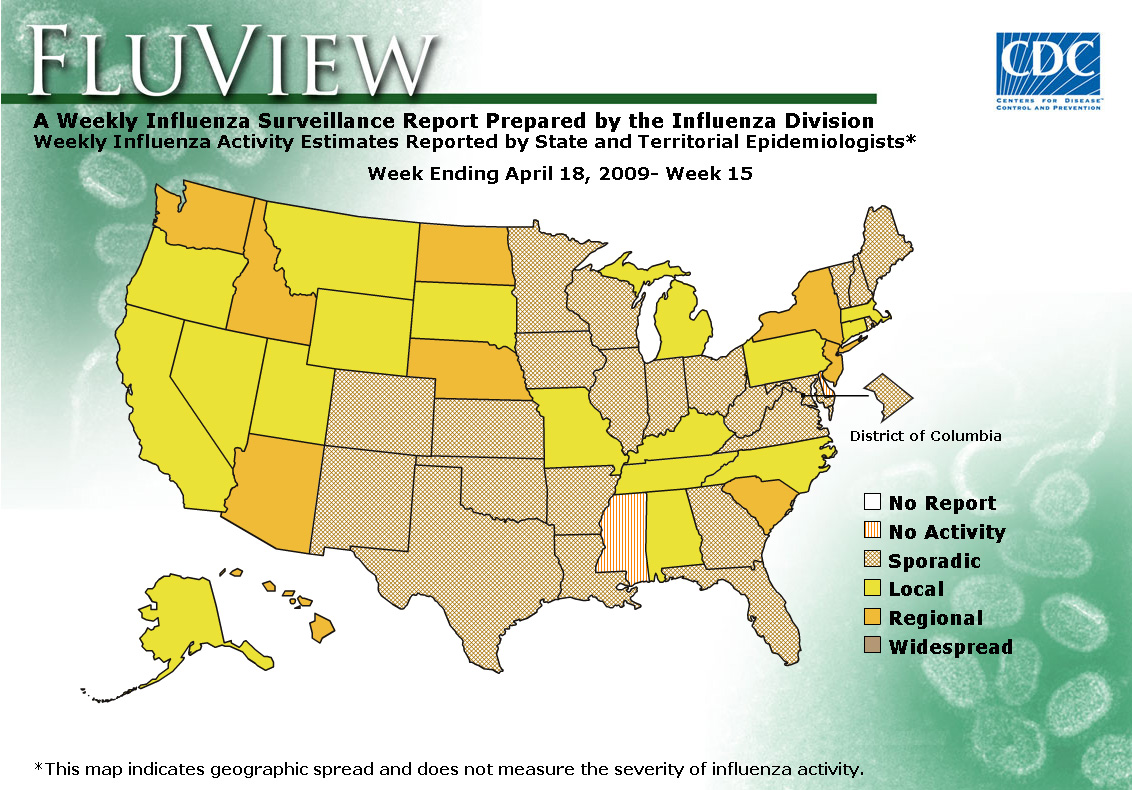
- Nine states reported regional activity; 17 states reported local influenza activity; the District of Columbia and 22 states reported sporadic influenza activity; and two states reported no influenza activity.
- Seven human infections with swine influenza A (H1N1) virus have been confirmed.
Region |
Data for current week | Data cumulative for the season | ||||||
|---|---|---|---|---|---|---|---|---|
| Out-patient ILI* | % positive for flu?/strong> | Number of jurisdictions reporting regional or widespread activity?/strong> | A (H1) | A (H3) | A Unsub-typed | B | Pediatric Deaths | |
| Nation | Normal | 6.2 % | 9 of 51 | 6223 | 750 | 10266 | 8686 | 55 |
| New England | Normal | 5.9 % | 0 of 6 | 445 | 67 | 1058 | 738 | 1 |
| Mid-Atlantic | Normal | 13.6 % | 2 of 3 | 754 | 100 | 988 | 929 | 11 |
| East North Central | Normal | 24.9 % | 0 of 5 | 987 | 62 | 296 | 884 | 8 |
| West North Central | Normal | 11.5 % | 2 of 7 | 924 | 41 | 868 | 762 | 0 |
| South Atlantic | Normal | 11.2 % | 1 of 9 | 1001 | 56 | 1963 | 1812 | 8 |
| East South Central | Normal | 2.5 % | 0 of 4 | 186 | 6 | 58 | 108 | 4 |
| West South Central | Normal | 4.7 % | 0 of 4 | 589 | 40 | 3727 | 2357 | 11 |
| Mountain | Normal | 6.5 % | 2 of 8 | 679 | 201 | 838 | 427 | 8 |
| Pacific | Normal | 11.6 % | 2 of 5 | 658 | 177 | 470 | 669 | 4 |
* Elevated means the % of visits for ILI is at or above the national or
region-specific baseline
† National data is for current week; regional data is for the most recent three weeks.
‡ Includes all 50 states and the District of Columbia
U.S. Virologic Surveillance:
WHO and NREVSS collaborating laboratories located in all 50 states and Washington D.C. report to CDC the number of respiratory specimens tested for influenza each week. The results of tests performed during the current week and cumulative totals for the season are summarized in the table below.
| Week 15 | Cumulative for the Season | |
|---|---|---|
| No. of specimens tested | 2,449 | 183,839 |
| No. of positive specimens (%) | 151 (6.2%) | 25,925 (14.1%) |
| Positive specimens by type/subtype | ||
| Influenza A | 74 (49.0%) | 17,239 (66.5%) |
| A (H1) | 15 (20.3%) | 6,223 (36.1%) |
| A (H3) | 9 (12.2%) | 750 (4.4%) |
| A (unsubtyped) | 50 (67.6%) | 10,266 (59.6%) |
| Influenza B | 77 (51.0%) | 8,686 (33.5%) |
During the 2008-09 season, influenza A (H1), A (H3), and B viruses have co-circulated in the United States. Influenza A (H1) viruses have predominated during the season overall, however, the most commonly reported influenza virus has varied by week. From week 40 through week 10 (September 28, 2008 ?March 14, 2009) influenza A (H1) viruses were more frequently reported and from weeks 11 through 13 (March 15 ?April 4, 2009) more influenza B than influenza A viruses were reported. Since week 14, small numbers of positive influenza specimens have been reported; approximately half of influenza viruses reported nationally have been influenza A viruses and half have been influenza B viruses, but there continues to be variation in the predominant influenza type by region. During week 15, five of the nine surveillance regions reported more influenza A than influenza B viruses.
View WHO-NREVSS Regional Bar Charts| View Chart Data | View Full Screen
Human Infections with Swine Influenza A Virus:
On April 17, 2009, CDC and the California Department of Public Health determined that two cases of febrile respiratory illness occurring in children who reside in adjacent counties in southern California were caused by infection with a swine influenza A (H1N1) virus. On April 22, CDC confirmed an additional three cases of swine influenza among residents of the two counties, two adults and one adolescent. All case-patients had symptoms of ILI. Additional testing at CDC identified swine influenza A (H1N1). All five had self-limited ILI and have recovered; one required hospitalization. Two additional cases were identified from Texas and confirmed as swine influenza at CDC on April 23.
Of the five case-patients with swine influenza A (H1N1) infection from California, two are a father and daughter and other than the father-daughter, the five case-patients have no known epidemiologic link or contact with pigs. The two new case-patients from Texas are schoolmates and an epidemiologic investigation is currently underway.
The viruses from all seven cases are closely related genetically and contain a unique combination of gene segments that have not been reported in the United States or elsewhere. Viruses from 6 cases are all resistant to amantadine and rimantidine and sensitive to zanamivir and oseltamivir, and sensitivity testing is underway for the remaining virus.
Vaccination with seasonal influenza vaccine containing human influenza A (H1N1) would not be expected to provide protection against swine influenza A (H1N1) viruses.
Additional information on swine influenza is available at http://www.cy118119.com/flu/swine/index.htm
Composition of the 2009-10 Influenza Vaccine:
WHO has recommended vaccine strains for the 2009-10 Northern Hemisphere trivalent influenza vaccine, and the Food and Drug Administration (FDA) has made the same recommendations for the U.S. influenza vaccine. Both agencies are recommending that the vaccine contain A/Brisbane/59/2007-like (H1N1), A/Brisbane/10/2007-like (H3N2), and B/Brisbane/60/2008-like (B/Victoria lineage) viruses. Only the influenza B component has been changed from the 2008-09 vaccine formulation. This recommendation was based on surveillance data related to epidemiology and antigenic characteristics, serological responses to 2008-09 vaccines, and the availability of candidate strains and reagents.
Antigenic Characterization:
CDC has antigenically characterized 1,137 influenza viruses [723 influenza A (H1), 107 influenza A (H3) and 307 influenza B viruses] collected by U.S. laboratories since October 1, 2008.
All 723 human influenza A (H1) viruses are related to the influenza A (H1N1) component of the 2008-09 influenza vaccine (A/Brisbane/59/2007). All 107 influenza A (H3N2) viruses are related to the A (H3N2) vaccine component (A/Brisbane/10/2007).
Influenza B viruses currently circulating can be divided into two distinct lineages represented by the B/Yamagata/16/88 and B/Victoria/02/87 viruses. Fifty-one influenza B viruses tested belong to the B/Yamagata lineage and are related to the vaccine strain (B/Florida/04/2006). The remaining 256 viruses belong to the B/Victoria lineage and are not related to the vaccine strain.
Data on antigenic characterization should be interpreted with caution given that antigenic characterization data is based on hemagglutination inhibition (HI) testing using a panel of reference ferret antisera and results may not correlate with clinical protection against circulating viruses provided by influenza vaccination.
Annual influenza vaccination is expected to provide the best protection against those virus strains that are related to the vaccine strains, but limited to no protection may be expected when the vaccine and circulating virus strains are so different as to be from different lineages, as is seen with the two lineages of influenza B viruses.
Antiviral Resistance:
Since October 1, 2008, 770 influenza A (H1N1), 118 influenza A (H3N2), and 328 influenza B viruses have been tested for resistance to the neuraminidase inhibitors (oseltamivir and zanamivir). Seven hundred sixty-seven influenza A (H1N1) and 116 influenza A (H3N2) viruses have been tested for resistance to the adamantanes (amantadine and rimantadine). The results of antiviral resistance testing performed on these viruses are summarized in the table below.
| Isolates tested (n) | Resistant Viruses, Number (%) |
Isolates tested (n) | Resistant Viruses, Number (%) | ||
|---|---|---|---|---|---|
| Oseltamivir | Zanamivir | Adamantanes | |||
| Influenza A (H1N1) | 770 | 765 (99.4%) | 0 (0) | 767 | 3 (0.4%) |
| Influenza A (H3N2) | 118 | 0 (0) | 0 (0) | 116 | 116 (100%) |
| Influenza B | 328 | 0 (0) | 0 (0) | N/A* | N/A* |
Influenza A (H1N1) viruses from 44 states and Puerto Rico have been tested for antiviral resistance to oseltamivir so far this season. To date, all influenza A (H3N2) viruses tested are resistant to the adamantanes and all oseltamivir-resistant influenza A (H1N1) viruses tested are sensitive to the adamantanes. Nationally, influenza A (H1N1) viruses have predominated during the season overall. Although influenza activity continues to decrease nationally, the relative proportion of influenza B viruses increased during March and April. During week 15, influenza B viruses accounted for 51% of the influenza viruses identified nationally. This presents challenges for the selection of antiviral medications for the treatment and chemoprophylaxis of influenza. Health care providers should be aware of the possibility of increased influenza B circulation in their area and continue to test patients for influenza and consult local surveillance data when evaluating patients with acute respiratory infections during the influenza season. CDC issued interim recommendations for the use of influenza antiviral medications in the setting of oseltamivir resistance among circulating influenza A (H1N1) viruses on December 19, 2008. These interim recommendations are available at http://www2a.cdc.gov/HAN/ArchiveSys/ViewMsgV.asp?AlertNum=00279.
Pneumonia and Influenza (P&I) Mortality Surveillance
During week 15, 6.8% of all deaths reported through the 122-Cities Mortality Reporting System were due to P&I. This percentage is below to the epidemic threshold of 7.7% for week 15.
View Full Screen
Influenza-Associated Pediatric Mortality
Two influenza-associated pediatric deaths were reported to CDC during week 15 (New York and Ohio). The deaths reported this week occurred between February 15 and March 28, 2009. Since September 28, 2008, CDC has received 55 reports of influenza-associated pediatric deaths that occurred during the current season.
Of the 29 children who had specimens collected for bacterial culture from normally sterile sites, 12 (41.4%) were positive; Staphylococcus aureus was identified in eight (66.7%) of the 12 children. Three of the S. aureus isolates were sensitive to methicillin and five were methicillin resistant. All 12 children with bacterial coinfections were five years of age or older and 10 (83.3%) of the 12 children were 12 years of age or older. An increase in the number of influenza-associated pediatric deaths with bacterial coinfections was first recognized during the 2006-07 influenza season. In January 2008, interim testing and reporting recommendations were released regarding influenza and bacterial coinfections in children and are available at (http://www2a.cdc.gov/HAN/ArchiveSys/ViewMsgV.asp?AlertNum=00268).
View Full Screen
Influenza-Associated Hospitalizations
Laboratory-confirmed influenza-associated hospitalizations are monitored in two population-based surveillance networks: the New Vaccine Surveillance Network (NVSN) and the Emerging Infections Program (EIP). These two systems provide updates of surveillance data every two weeks.
During October 12, 2008 to April 4, 2009, the preliminary laboratory-confirmed influenza-associated hospitalization rate for children 0-4 years old in the NVSN was 2.87 per 10,000. Because of case identification methods utilized in this study, a delay exists from the date of hospitalization to the date of report.
View Full Screen
During October 1, 2008 ?April 11, 2009, preliminary laboratory-confirmed influenza-associated hospitalization rates reported by the EIP for children aged 0-4 years and 5-17 years were 3.3 per 10,000 and 0.5 per 10,000, respectively. For adults aged 18-49 years, 50-64 years, and >= 65 years, the rates were 0.3 per 10,000, 0.4 per 10,000, and 1.2 per 10,000, respectively.
View Full Screen
Outpatient Illness Surveillance:
Nationwide during week 15, 1.3% of patient visits reported through the U.S. Outpatient Influenza-like Illness Surveillance Network (ILINet) were due to influenza-like illness (ILI). This percentage is below the national baseline of 2.4%.
View Sentinel Providers Regional Charts | View Chart Data |View Full Screen
On a regional level, the percentage of visits for ILI ranged from 0.5% to 2.4%. All surveillance regions reported an ILI percentage below their region specific baselines.
| Region | New England | Mid- Atlantic | East North Central | West North Central | South Atlantic | East South Central | West South Central | Mountain | Pacific |
|---|---|---|---|---|---|---|---|---|---|
| Reported ILI (%) | 0.5 | 2.0 | 0.8 | 0.9 | 1.0 | 2.4 | 1.4 | 1.3 | 1.4 |
| Region-Specific Baseline | 1.5 | 2.9 | 1.9 | 1.7 | 2.2 | 2.5 | 4.8 | 1.5 | 3.0 |
Geographic Spread of Influenza as Assessed by State and Territorial Epidemiologists:
During week 15, the following influenza activity was reported:
- Regional influenza activity was reported by nine states (Arizona, Hawaii, Idaho, Nebraska, New Jersey, New York, North Dakota, South Carolina, and Washington)
- Local influenza activity was reported by 17 states (Alabama, Alaska, California, Connecticut, Kentucky, Massachusetts, Michigan, Missouri, Montana, Nevada, North Carolina, Oregon, Pennsylvania, South Dakota, Tennessee, Utah, and Wyoming)
- Sporadic activity was reported by the District of Columbia and 22 states (Arkansas, Colorado, Florida, Georgia, Illinois, Indiana, Iowa, Kansas, Louisiana, Maine, Maryland, Minnesota, New Hampshire, New Mexico, Ohio, Oklahoma, Rhode Island, Texas, Vermont, Virginia, West Virginia, and Wisconsin).
- No influenza activity was reported by two states (Delaware and Mississippi).
--------------------------------------------------------------------------------
A description of surveillance methods is available at: http://www.cy118119.com/flu/weekly/fluactivity.htm
- Page last updated April 24, 2009.