Error processing SSI file
Error processing SSI file
Weekly Report: Influenza Summary Update
Week ending April 29, 2006-Week 17
Error processing SSI fileSynopsis:
Influenza activity in the United States peaked in early March and continued to decline during week 17 (April 23 ?April 29, 2006)*. Ninety-seven specimens (9.4%) tested by U.S. World Health Organization (WHO) and National Respiratory and Enteric Virus Surveillance System (NREVSS) collaborating laboratories were positive for influenza. The proportion of patient visits to sentinel providers for influenza-like illness (ILI) was below the national baseline. The proportion of deaths attributed to pneumonia and influenza was below the baseline level. Three states reported regional influenza activity; four states and the District of Columbia reported local influenza activity; 38 states, New York City, and Puerto Rico reported sporadic influenza activity; and five states reported no activity.
Laboratory Surveillance*:
During week 17, WHO and NREVSS laboratories reported 1,032 specimens tested for influenza viruses and 97 (9.4%) were positive. Of these, 1 was an influenza A (H3N2) virus, 4 were influenza A (H1N1) viruses, 25 were influenza A viruses that were not subtyped, and 67 were influenza B viruses.
Since October 2, 2005, WHO and NREVSS laboratories have tested a total of 129,924 specimens for influenza viruses and 16,547 (12.7%) were positive. Among the 16,547 influenza viruses, 13,647 (82.5%) were influenza A viruses and 2,900 (17.5%) were influenza B viruses. Five thousand five hundred forty-eight (40.7%) of the 13,647 influenza A viruses have been subtyped: 5,154 (92.9%) were influenza A (H3N2) viruses and 394 (7.1%) were influenza A (H1N1) viruses. During the past three weeks (weeks 15?7), the percentage of specimens testing positive for influenza has ranged from 14.5% in the West South Central region to 6.0% in the East South Central region**. During this period, the proportion of isolates identified as influenza B viruses continued to increase. During weeks 15-17, the New England region reported the highest proportion of isolates as influenza B (75.2%). Other regions reporting more than 60.0% of recent isolates as influenza B include the West South Central, West North Central, East North Central, and Pacific regions.
View Chart Data | View Full Screen
Composition of the 2006-07 Influenza Vaccine:
WHO has recommended that the 2006-07 trivalent influenza vaccine for the Northern Hemisphere contain A/New Caledonia/20/99-like (H1N1), A/Wisconsin/67/2005-like (H3N2), and B/Malaysia/2506/2004-like viruses. The influenza A (H3N2) and the influenza B components have been changed from the 2005-06 season vaccine components. A/Wisconsin/67/2005 is an antigenic variant of the current vaccine strain A/California/07/2004. Influenza B viruses currently circulating can be divided into two antigenically distinct lineages represented by B/Yamagata/16/88 and B/Victoria/2/87 viruses. The updating of the influenza B component to B/Ohio/1/2005 (which is antigenically equivalent to B/Malaysia/2506/2004) represents a change to the B/Victoria lineage. This recommendation was based on antigenic analyses of recently isolated influenza viruses, epidemiologic data, and post-vaccination serologic studies in humans.
Antigenic Characterization:
CDC has antigenically characterized 663 influenza viruses [478 influenza A (H3N2), 57 influenza A (H1), and 128 influenza B viruses] collected by U.S. laboratories since October 1, 2005. Of the 478 influenza A (H3N2) viruses, 362 (75.7%) were characterized as A/California/07/2004-like, which is the influenza A (H3N2) component recommended for the 2005-06 influenza vaccine, and 116 (24.3%) viruses showed reduced titers with antisera produced against A/California/07/2004. Of the 116 low-reacting viruses, 90 were tested with antisera produced against A/Wisconsin/67/2005 (the H3N2 component selected for the 2006-07 vaccine), and 67 are A/Wisconsin-like. The hemagglutinin proteins of 54 (94.7%) influenza A (H1) viruses were antigenically similar to the hemagglutinin of the vaccine strain A/New Caledonia/20/99, and 3 (5.3%) showed reduced titers with antisera produced against A/New Caledonia/20/99. Forty (31.3%) of the influenza B viruses that have been characterized belong to the B/Yamagata lineage. Five were similar to B/Shanghai/361/2002, the recommended influenza B component for the 2005-06 influenza vaccine, 34 were characterized as B/Florida/07/2004-like, and 1 showed reduced titers with antisera produced against both B/Shanghai/361/2002 and B/Florida/07/2004. B/Florida/07/2004 is a minor antigenic variant of B/Shanghai/361/2002. Eighty-eight (68.8%) influenza B viruses were identified as belonging to the B/Victoria lineage and all were similar to B/Ohio/1/2005, the influenza B component selected for the 2006-07 vaccine.
Pneumonia and Influenza (P&I) Mortality Surveillance*:
During week 17, 7.1% of all deaths reported by the vital statistics offices of 122 U.S. cities were due to pneumonia or influenza. This percentage is below the epidemic threshold of 7.8% for week 17.
Influenza-Associated Pediatric Mortality*:
During October 2, 2005 ?April 29, 2006, CDC received reports of 30 influenza-associated pediatric deaths, 28 of which occurred during the current influenza season.
Influenza-Associated Pediatric Hospitalizations*:
Laboratory-confirmed influenza-associated pediatric hospitalizations are monitored in two population-based surveillance networks?/sup>: Emerging Infections Program (EIP) and New Vaccine Surveillance Network (NVSN). During October 1, 2005 ?April 15, 2006, the preliminary influenza-associated hospitalization rate reported by EIP for children aged 0-17 years was 1.08 per 10,000. For children aged 0-4 years and 5-17 years, the rate was 2.47 per 10,000 and 0.35 per 10,000, respectively. During October 30, 2005 ?April 15, 2006, the preliminary laboratory-confirmed influenza-associated hospitalization rate for children aged 0-4 years in NVSN was 4.3 per 10,000. EIP and NVSN hospitalization rate estimates are preliminary and may change as data continue to be collected.
View
Full Screen
View
Full Screen
Influenza-like Illness Surveillance*:
During week 17, 1.2%*** of patient visits to U.S. sentinel providers were due to ILI. This percentage is below the national baseline of 2.2%. The percentage of visits for ILI ranged from 0.5% in the West North Central region to 2.5% in the West South Central region. Due to wide variability in regional level data, it is not appropriate to apply the national baseline to regional level data.
View
Chart Data
| View Full Screen
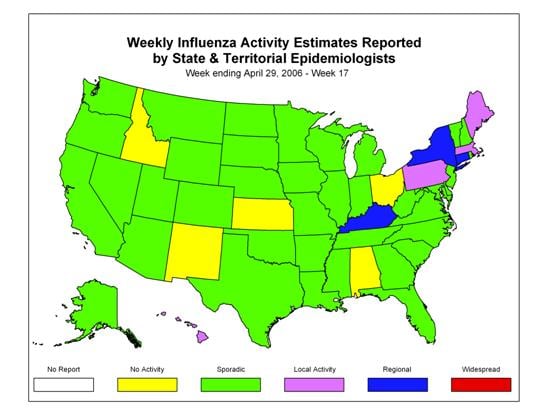
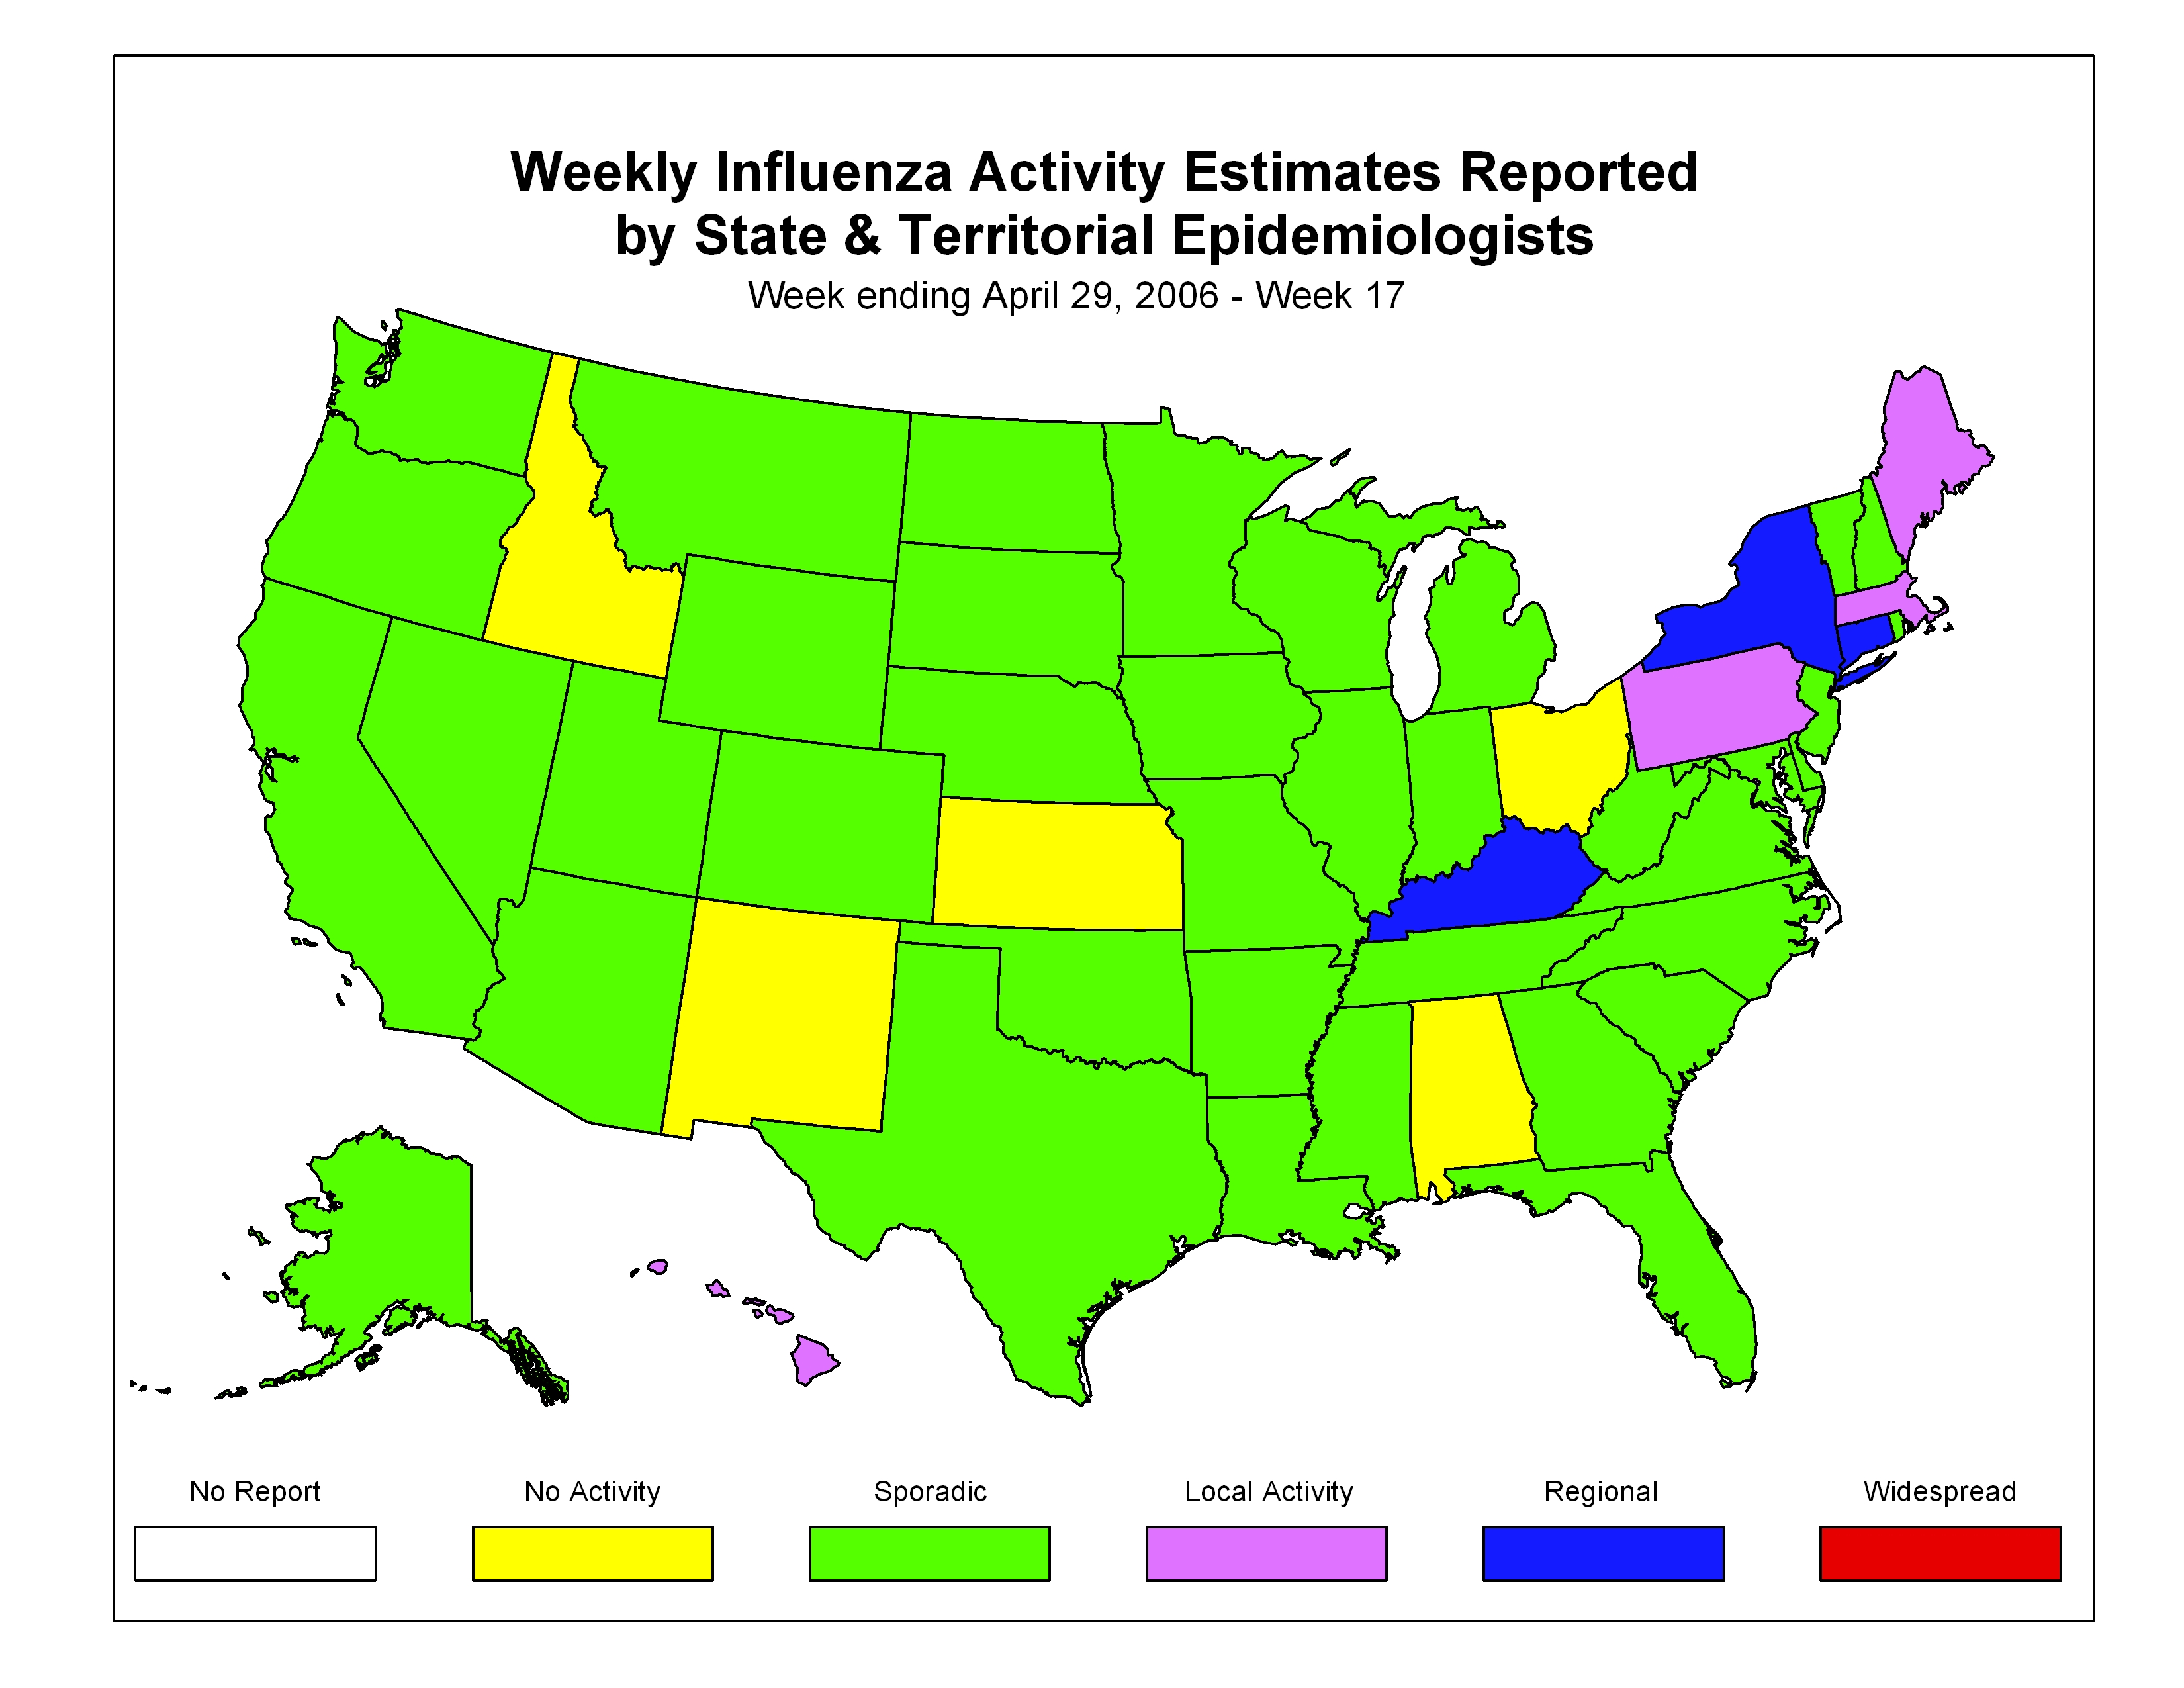
Influenza Activity as Assessed by State and Territorial Epidemiologists*:
During week 17, 3 states (Connecticut, Kentucky, and New York) reported regional influenza activity. Four states (Hawaii, Maine, Massachusetts, and Pennsylvania), and the District of Columbia reported local influenza activity. Thirty-eight states (Alaska, Arizona, Arkansas, California, Colorado, Delaware, Florida, Georgia, Illinois, Indiana, Iowa, Louisiana, Maryland, Michigan, Minnesota, Mississippi, Missouri, Montana, Nebraska, Nevada, New Hampshire, New Jersey, North Carolina, North Dakota, Oklahoma, Oregon, Rhode Island, South Carolina, South Dakota, Tennessee, Texas, Utah, Vermont, Virginia, Washington, West Virginia, Wisconsin, and Wyoming), New York City, and Puerto Rico reported sporadic influenza activity. Five states (Alabama, Idaho, Kansas, Ohio, and New Mexico) reported no activity.
--------------------------------------------------------------------------------
Report prepared May 5, 2006
Error processing SSI file