Sample Camp Activities

Sample Camp Activities
Distribution and Outliers

Learn about distributions by examining the height of fellow campers. See how a 7-foot-tall basketball player throws off the average height of the class.
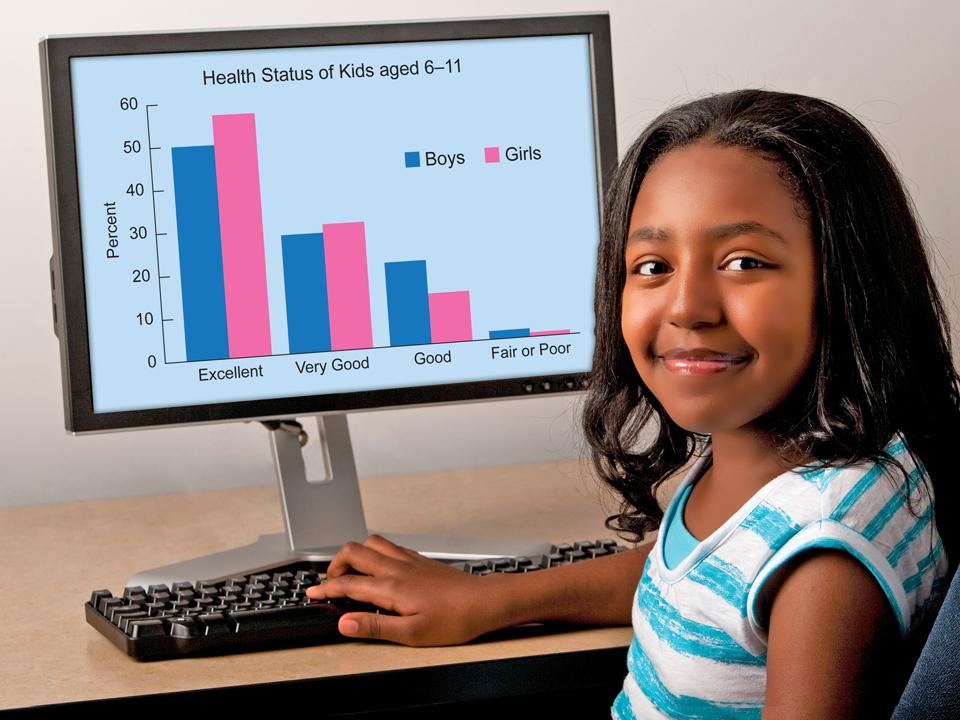
Learn to display your data through figures and charts. How does data visualization allow you to interpret your data and draw conclusions?

Collect data and analyze it to draw comparisons between variables, such as number of siblings and arm span. Can you draw any conclusions?

Review the concepts you learned on the last day of camp with fun, group trivia games.
The National Center for Health Statistics, CDC
Camp Director, Dr. Ryne Paulose, Director of Operations, Juliana McAllister, and Director of Statistics, Dr. Gladys Martinez


The Data Detectives wordmark and the Data Detectives design mark are trademarks of the U.S. Department of Health and Human Services. Unauthorized use of the marks is strictly prohibited.