
2008-2009 Influenza Season Week 39 ending October 3, 2009
All data are preliminary and may change as more reports are received.
Synopsis:
During week 39 (September 27-October 3, 2009), influenza activity increased in the U.S.
- 2,968 (27.4%) specimens tested by U.S. World Health Organization (WHO) and National Respiratory and Enteric Virus Surveillance System (NREVSS) collaborating laboratories and reported to CDC/Influenza Division were positive for influenza.
- 99% of all subtyped influenza A viruses being reported to CDC were 2009 influenza A (H1N1) viruses.
- The proportion of deaths attributed to pneumonia and influenza (P&I) was at the epidemic threshold.
- Nineteen influenza-associated pediatric deaths were reported. Sixteen of these deaths were associated with 2009 influenza A (H1N1) virus infection and three were associated with influenza A virus, for which subtype is undetermined.
- The proportion of outpatient visits for influenza-like illness (ILI) was above the national baseline. Regions 3 through 10 reported ILI above region-specific baseline levels; Regions 1 and 2 were below region-specific baselines.
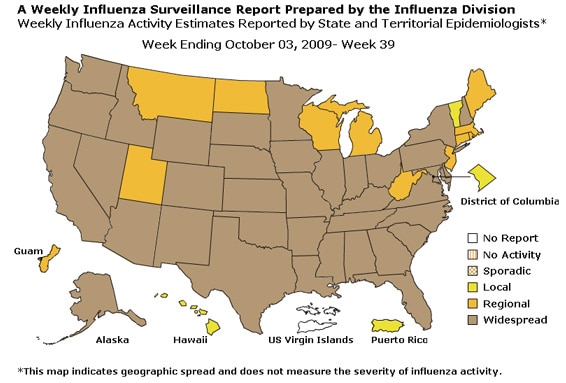
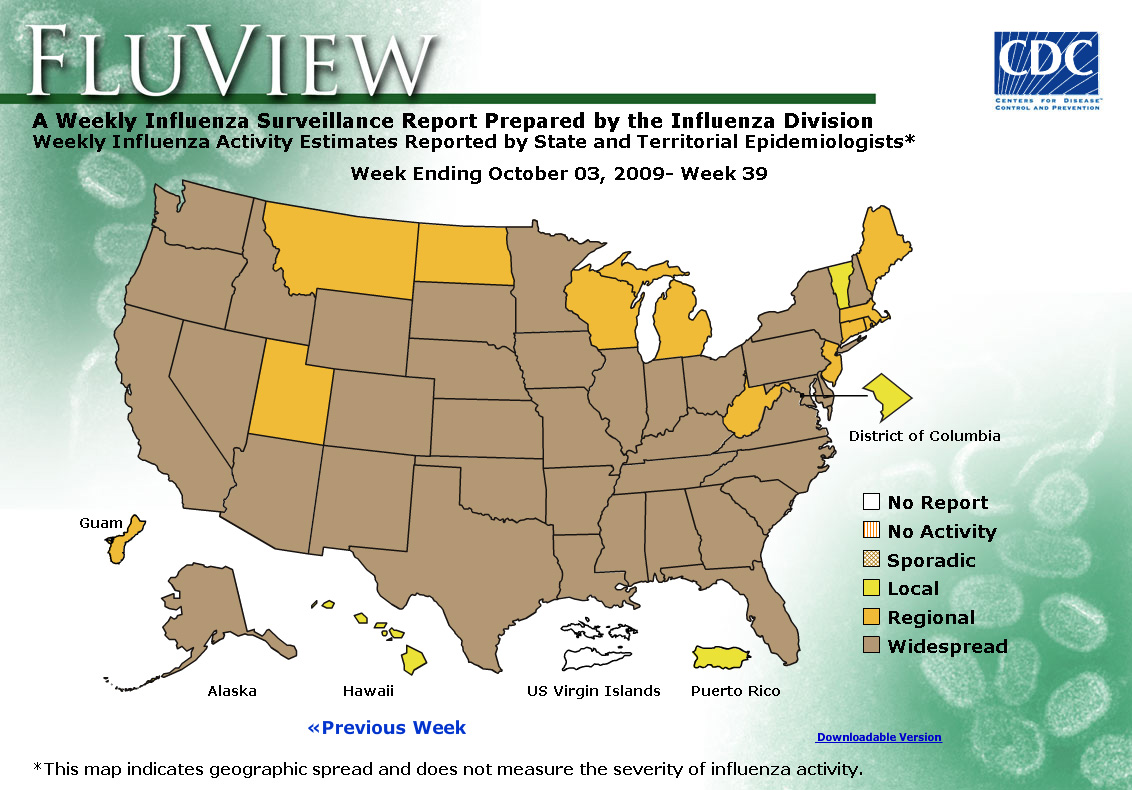
- Thirty-seven states reported geographically widespread influenza activity, Guam and 11 states reported regional influenza activity, two states, the District of Columbia, and Puerto Rico reported local influenza activity, and the U.S. Virgin Islands did not report.
| HHS Surveillance Regions* | Data for current week | Data cumulative for the season | ||||||||
|---|---|---|---|---|---|---|---|---|---|---|
| Out-patient ILI† | % positive for flu‡ | Number of jurisdictions reporting regional or widespread activity§ | A (H1) | A (H3) | 2009 A (H1N1) | A (unable to sub-type)¥ | A(Subtyping not performed) | B | Pediatric Deaths | |
| Nation | Elevated | 27.4 % | 49 of 54 | 8,361 | 4,376 | 50,768 | 972 | 30,999 | 11,302 | 147 |
| Region 1 | Normal | 6.9 % | 5 of 6 | 587 | 304 | 3,134 | 15 | 1,275 | 651 | 4 |
| Region 2 | Normal | 2.1 % | 2 of 4 | 290 | 228 | 1,834 | 21 | 2,412 | 713 | 20 |
| Region 3 | Elevated | 23.8 % | 5 of 6 | 1,250 | 225 | 5,685 | 26 | 1,656 | 1,628 | 13 |
| Region 4 | Elevated | 25.8 % | 8 of 8 | 1,078 | 784 | 9,257 | 119 | 5,844 | 1,320 | 21 |
| Region 5 | Elevated | 21.1 % | 6 of 6 | 1,632 | 218 | 9,442 | 240 | 2,183 | 1,473 | 19 |
| Region 6 | Elevated | 33.2 % | 5 of 5 | 830 | 312 | 4,861 | 15 | 9,198 | 2,821 | 29 |
| Region 7 | Elevated | 29.1 % | 4 of 4 | 565 | 87 | 2,006 | 154 | 927 | 550 | 2 |
| Region 8 | Elevated | 23.2 % | 6 of 6 | 542 | 219 | 2,651 | 80 | 3,729 | 612 | 13 |
| Region 9 | Elevated | 32.0 % | 4 of 5 | 1,200 | 1,681 | 8,596 | 83 | 3,218 | 848 | 22 |
| Region 10 | Elevated | 33.8 % | 4 of 4 | 387 | 318 | 3,302 | 219 | 557 | 686 | 4 |
* HHS regions (Region 1: CT, ME, MA, NH, RI, VT; Region 2: NJ, NY, Puerto Rico, US Virgin Islands; Region 3: DE, DC, MD, PA, VA, WV; Region 4: AL, FL, GA, KY, MS, NC, SC, TN; Region 5: IL, IN, MI, MN, OH, WI; Region 6: AR, LA, NM, OK, TX; Region 7: IA, KS, MO, NE;
Region 8: CO, MT, ND, SD, UT, WY; Region 9: AZ, CA, Guam, HI, NV; and Region 10: AK, ID, OR, WA)
† Elevated means the % of visits for ILI is at or above the national or region-specific baseline
‡ National data are for current week; regional data are for the most recent three weeks
§ Includes all 50 states, the District of Columbia, Guam, Puerto Rico, and U.S. Virgin Islands
¥ The majority of influenza A viruses that cannot be sub-typed as seasonal influenza viruses are 2009 A (H1N1) influenza viruses upon further testing
U.S. Virologic Surveillance:
WHO and NREVSS collaborating laboratories located in all 50 states and Washington D.C. report to CDC the number of respiratory specimens tested for influenza and the number positive by influenza type and subtype. The results of tests performed during the current week are summarized in the table below.
| Week 39 | |
|---|---|
| No. of specimens tested | 10,816 |
| No. of positive specimens (%) | 2,968 (27.4%) |
| Positive specimens by type/subtype | |
| Influenza A | 2,959 (99.7%) |
| A (2009 H1N1) | 1,549 (52.3%) |
| 1,368 (46.2%) | |
| A (unable to subtype) | 40 (1.4%) |
| A (H3) | 1 (0.1%) |
| A (H1) | 1 (0.1%) |
| Influenza B | 9 (0.3%) |
During week 39, seasonal influenza A (H1), A (H3) and influenza B viruses co-circulated at low levels with 2009 influenza A (H1N1) viruses. Over 99% of all subtyped influenza A viruses reported to CDC this week were 2009 influenza A (H1N1) viruses.
View WHO-NREVSS Regional Bar Charts| View Chart Data | View Full Screen
Pneumonia and Influenza Hospitalization and Death Tracking:
This new system was implemented on August 30, 2009, and replaces the weekly report of laboratory confirmed 2009 H1N1-related hospitalizations and deaths that began in April 2009. Jurisdictions can now report to CDC either laboratory confirmed or pneumonia and influenza syndromic-based counts of hospitalizations and deaths resulting from all types or subtypes of influenza, not just those from 2009 H1N1 influenza virus. To allow jurisdictions to implement the new case definition, counts were reset to zero on August 30, 2009. From August 30 – October 3, 2009, 3,874 laboratory-confirmed influenza associated hospitalizations, 240 laboratory-confirmed influenza associated deaths, 12,384 pneumonia and influenza syndrome-based hospitalizations, and 1,544 pneumonia and influenza syndrome-based deaths, were reported to CDC. CDC will continue to use its traditional surveillance systems to track the progress of the remainder of the 2008-09 season, and for the 2009-10 influenza season, which officially began October 4, 2009.
View Full Screen
Antigenic Characterization:
CDC has antigenically characterized 2,209 seasonal human influenza viruses [1,192 influenza A (H1), 276 influenza A (H3) and 714 influenza B viruses] collected by U.S. laboratories since October 1, 2008, and 822 2009 influenza A (H1N1) viruses.
1,192 (98%) of 1,213 seasonal influenza A (H1) viruses tested are related to the influenza A (H1N1) component of the 2009-10 Northern Hemisphere influenza vaccine (A/Brisbane/59/2007) and 27 (2%) showed reduced titers with antisera produced against A/Brisbane/59/2007.
Two hundred twenty-nine (83%) of 276 influenza A (H3N2) viruses tested are related to the influenza A (H3N2) 2009-10 Northern Hemisphere vaccine component (A/Brisbane/10/2007-like) and 47 viruses (17%) tested showed reduced titers with antisera produced against A/Brisbane/10/2007. Many current viruses that demonstrated reduced titers with antisera produced against A/Brisbane/10/2007 are related to A/Perth/16/2009, a new reference virus that has recently evolved from A/Brisbane/10/2007. An A/Perth/16/2009-like virus was recommended by WHO as the influenza A (H3N2) vaccine strain for the 2010 Southern Hemisphere influenza vaccine.
Eight hundred twenty-one (99.9%) of 822 2009 influenza A (H1N1) viruses are related to the A/California/07/2009 (H1N1)pdm reference virus selected by WHO as the vaccine strain for the 2009-10 influenza A (H1N1) vaccine for the Northern Hemisphere. One virus (0.1%) demonstrated reduced titers with antisera produced against A/California/07/2009 (H1N1).
Influenza B viruses currently circulating can be divided into two distinct lineages represented by the B/Yamagata/16/88 and B/Victoria/02/87 viruses. Six hundred thirty-eight (89%) of 714 influenza B viruses tested belong to the B/Victoria lineage, and of these, 630 (99%) are related to the influenza vaccine component for the 2009-10 Northern Hemisphere influenza vaccine (B/Brisbane/60/2008), and the remaining eight (1%) showed reduced titers with antisera produced against B/Brisbane/60/2008. Seventy-six (11%) of 714 influenza B viruses tested belong to the B/Yamagata lineage.
Data on antigenic characterization should be interpreted with caution given that antigenic characterization data are based on hemagglutination inhibition (HI) testing using a panel of reference ferret antisera, and results may not correlate with clinical protection against circulating viruses provided by influenza vaccination.
Annual influenza vaccination is expected to provide the best protection against those virus strains that are related to the vaccine strains, but limited to no protection may be expected when the vaccine and circulating virus strains are so different as to be from different lineages, as is seen with the two lineages of influenza B viruses. Antigenic characterization of 2009 influenza A (H1N1) viruses indicates that these viruses are antigenically and genetically unrelated to seasonal influenza A (H1N1) viruses, suggesting that little to no protection would be expected from vaccination with seasonal influenza vaccine.
Antiviral Resistance:
Since October 1, 2008, 1,151 seasonal influenza A (H1N1), 264 influenza A (H3N2), 654 influenza B, and 989 2009 influenza A (H1N1) virus isolates have been tested for resistance to the neuraminidase inhibitors (oseltamivir and zanamivir). In addition, 1,051 2009 influenza A (H1N1) original clinical samples were tested for a single known mutation in the virus that confers oseltamivir resistance. Also, 1,157 seasonal influenza A (H1N1), 271 influenza A (H3N2), and 526 2009 influenza A (H1N1) viruses have been tested for resistance to the adamantanes (amantadine and rimantadine). The results of antiviral resistance testing performed on these viruses are summarized in the table below. Additional laboratories perform antiviral testing and report their results to CDC.
| Samples tested (n) | Resistant Viruses, Number (%) |
Samples tested (n) | Resistant Viruses, Number (%) | Samples tested (n) | Resistant Viruses, Number (%) | |
|---|---|---|---|---|---|---|
| Oseltamivir | Zanamivir | Adamantanes | ||||
| Seasonal Influenza A (H1N1) | 1,151 | 1,146 (99.6%) | 1,151 | 0 (0) | 1,157 | 7 (0.6%) |
| Influenza A (H3N2) | 264 | 0 (0) | 264 | 0 (0) | 271 | 271 (100%) |
| Influenza B | 654 | 0 (0) | 654 | 0 (0) | N/A* | N/A* |
| 2009 Influenza A (H1N1) | 2,040 | 10†‡ (0.5) | 989 | 0 (0) | 526 | 526 (100%) |
*The adamantanes (amantadine and rimantadine) are not effective against influenza B viruses.
†Two screening tools were used to determine oseltamivir resistance: sequence analysis of viral genes or a neuraminidase inhibition assay.
‡Additional laboratories perform antiviral resistance testing and report their results to CDC. Two additional oseltamivir resistant 2009 influenza A (H1N1) viruses have been identified by these laboratories, bringing the total number to 12.
2009 influenza A (H1N1) viruses were tested for oseltamivir resistance by a neuraminidase inhibition assay and/or detection of genetic sequence mutation, depending on the type of specimen tested. Original clinical samples were examined for a single known mutation in the virus that confers oseltamivir resistance in currently circulating seasonal influenza A (H1N1) viruses, while influenza virus isolates were tested using a neuraminidase inhibition assay that determines the presence or absence of neuraminidase inhibitor resistance, followed by the neuraminidase gene sequence analysis of resistant viruses.
The majority of 2009 influenza A (H1N1) viruses are susceptible to the neuraminidase inhibitor antiviral medication oseltamivir; however, rare sporadic cases of oseltamivir resistant 2009 influenza A (H1N1) viruses have been detected worldwide, including 12 cases in the United States (10 viruses identified by CDC and two viruses identified by additional laboratories). The 12 total cases represent an increase of one case over the previous week. All tested viruses retain their sensitivity to the other neuraminidase inhibitor: zanamivir. Eleven patients (including nine of the viruses detected at CDC and both viruses identified by the additional laboratories) had documented exposure to oseltamivir through either treatment or chemoprophylaxis, and the remaining patient is currently under investigation to determine exposure to oseltamivir. Occasional development of oseltamivir resistance during treatment or prophylaxis is not unexpected. Enhanced surveillance is expected to detect additional cases of oseltamivir resistant 2009 influenza A (H1N1) viruses, and such cases will be investigated to assess the spread of resistant strains in the community.
To prevent the spread of antiviral resistant virus strains, CDC reminds clinicians and the public of the need to continue hand and cough hygiene measures for the duration of any symptoms of influenza, even while taking antiviral medications http://www.cy118119.com/mmwr/preview/mmwrhtml/mm5832a3.htm.
Additional information on antiviral recommendations for treatment and chemoprophylaxis of influenza virus infection is available at http://www.cy118119.com/h1n1flu/recommendations.htm) Antiviral treatment with oseltamivir or zanamivir is recommended for all patients with confirmed or suspected influenza virus infection who are hospitalized or who are at higher risk for influenza complications.
Four seasonal influenza A (H1N1) viruses collected between February 8 and August 12, 2009, were found to be resistant to both oseltamivir and the adamantanes (amantadine and rimantadine). All seasonal influenza A (H1N1) viruses tested retain their sensitivity to zanamivir. The four dually-resistant viruses represent less than 1% of all seasonal influenza A (H1N1) viruses tested during the 2008-09 influenza season, and as a result, no changes to the influenza antiviral treatment or prophylaxis recommendations will be made at this time. CDC will continue to monitor trends in antiviral resistance throughout the upcoming 2009-10 influenza season.
Pneumonia and Influenza (P&I) Mortality Surveillance
During week 39, 6.5% of all deaths reported through the 122-Cities Mortality Reporting System were due to P&I. This percentage was at the epidemic threshold of 6.5% for week 39.
View Full Screen
Influenza-Associated Pediatric Mortality
Nineteen influenza-associated pediatric deaths were reported to CDC during week 39 (Alaska, Arizona, Colorado, Florida, Maryland [2], North Carolina, Oklahoma, Tennessee [3], Texas [7], and Wisconsin). Sixteen of these deaths were associated with 2009 influenza A (H1N1) virus infection and three were associated with influenza A virus, for which subtype is undetermined. These deaths occurred between July 19 and October 3, 2009. Since September 28, 2008, CDC has received 147 reports of influenza-associated pediatric deaths that occurred during the current influenza season (28 deaths in children less than 2 years, 15 deaths in children 2-4 years, 45 deaths in children 5-11 years, and 59 deaths in individuals 12-17 years). Seventy-six of the 147 deaths were due to 2009 influenza A (H1N1) virus infections, and 29 of these have occurred since August 30, 2009.
Of the 66 children who had specimens collected for bacterial culture from normally sterile sites, 23 (34.8%) were positive; Staphylococcus aureus was identified in 16 (69.6%) of the 23 children. Six of the S. aureus isolates were sensitive to methicillin, nine were methicillin resistant, and one did not have sensitivity testing performed. Twenty-one (91.3%) of the 23 children with bacterial coinfections were five years of age or older and 15 (65.2%) of the 23 children were 12 years of age or older. Thirty-two (42.1%) of the 76 children with confirmed 2009 influenza A (H1N1) infection had a specimen collected from a normally sterile site; nine (28.1%) of the 32 children had a positive bacterial culture; seven of which were positive for S. aureus. Two of the S. aureus isolates were sensitive to methicillin, four were methicillin resistant, and one did not have sensitivity testing performed. Other bacteria identified include Streptococcus constellatus, Pseudomonas aeruginosa, Streptococcus, and Enterococcus.
View Full Screen
Influenza-Associated Hospitalizations
Laboratory-confirmed influenza-associated hospitalizations are monitored through the Emerging Infections Program (EIP), a population-based surveillance network.
During April 15, 2009 – October 3, 2009, the following preliminary laboratory-confirmed overall influenza associated hospitalization rates were reported by the EIP (rates include influenza A, influenza B, and 2009 influenza A (H1N1)):
Rates for children aged 0-23 months, 2-4 years, and 5-17 years were 3.6, 1.6, and 1.3 per 10,000, respectively. Rates for adults aged 18-49 years, 50-64 years, and ≥ 65 years, the overall flu rates were 0.8, 0.9, and 0.7 per 10,000, respectively.
*This value represents an age group-specific average influenza rate from October 1 to April 30 from the 2005-06, 2006-07, and 2007-08 influenza seasons.
**Note: The scales for the 0-23 month and the >= 65 years age groups differ from other age groups.
View Full Screen
Outpatient Illness Surveillance:
Nationwide during week 39, 5.1% of patient visits reported through the U.S. Outpatient Influenza-like Illness Surveillance Network (ILINet) were due to influenza-like illness (ILI). This percentage is above the national baseline of 2.4%.
View ILINet Regional Charts | View Chart Data |View Full Screen
On a regional level, the percentage of outpatient visits for ILI ranged from 1.3% to 9.5%, and increased in eight of the 10 surveillance regions. Eight regions (Regions 3 through 10) reported a proportion of outpatient visits for ILI above region-specific baseline levels, while Regions 1 and 2 reported a percentage of visits for ILI below region-specific baselines.
Geographic Spread of Influenza as Assessed by State and Territorial Epidemiologists:
The influenza activity reported by state and territorial epidemiologists indicates geographic spread of both seasonal influenza and 2009 influenza A (H1N1) viruses and does not measure the severity of influenza activity.
- During week 39, the following influenza activity was reported:
- Widespread influenza activity was reported by 37 states (Alabama, Alaska, Arizona, Arkansas, California, Colorado, Delaware, Florida, Georgia, Idaho, Illinois, Indiana, Iowa, Kansas, Kentucky, Louisiana, Maryland, Minnesota, Mississippi, Missouri, Nebraska, Nevada, New Hampshire, New Mexico, New York, North Carolina, Ohio, Oklahoma, Oregon, Pennsylvania, South Carolina, South Dakota, Texas, Tennessee, Virginia, Washington, and Wyoming).
- Regional influenza activity was reported by Guam and 11 states (Connecticut, Maine, Massachusetts, Michigan, Montana, New Jersey, North Dakota, Rhode Island, Utah, West Virginia, and Wisconsin)..
- Local influenza activity was reported by the District of Columbia, Puerto Rico, and two states (Hawaii and Vermont).
- The U.S. Virgin Islands did not report.
--------------------------------------------------------------------------------
A description of surveillance methods is available at: http://www.cy118119.com/flu/weekly/fluactivity.htm

- Page last reviewed: October 9, 2009
- Page last updated: October 9, 2009
- Content source: Centers for Disease Control and Prevention
800-CDC-INFO (800-232-4636) TTY: (888) 232-6348 - Contact CDC–INFO