Error processing SSI file
Weekly Report: Influenza Summary Update
2008-2009 Influenza Season Week 21 ending May 30, 2009
All data are preliminary and may change as more reports are received.(Due to the response to the novel influenza A (H1N1) investigation, surveillance regions were changed from Census Divisions to Department of Health and Human Services (HHS) Regions.)
Synopsis:
During week 21 (May 24 - 30, 2009), influenza activity decreased in the United States, however, there are still higher levels of influenza-like illness than is normal for this time of year.
- Two thousand seventy-four (31.1%) specimens tested by U.S. World Health Organization (WHO) and National Respiratory and Enteric Virus Surveillance System (NREVSS) collaborating laboratories and reported to CDC/Influenza Division were positive for influenza.
- The proportion of deaths attributed to pneumonia and influenza (P&I) was below the epidemic threshold.
- Five influenza-associated pediatric deaths were reported.
- The proportion of outpatient visits for influenza-like illness (ILI) was below the national baseline. Three of the 10 surveillance regions reported ILI at or above their region-specific baseline.
- Five states reported geographically widespread influenza activity, 10 states reported regional influenza activity, the District of Columbia and 14 states reported local influenza activity, and 21 states reported sporadic influenza activity.
HHS Surveillance Regions* |
Data for current week | Data cumulative for the season | ||||||||
|---|---|---|---|---|---|---|---|---|---|---|
| Out-patient ILI?/strong> | % positive for flu?/strong> | Number of jurisdictions reporting regional or widespread activity?/strong> | A (H1) | A (H3) | Novel A (H1N1) | A (could not be subyped)?/strong> | A(Unsub-typed) | B | Pediatric Deaths | |
| Nation | Normal | 31.1 % | 15 of 51 | 7,565 | 1,992 | 6,247 | 691 | 12,536 | 10,231 | 67 |
| Region I | Elevated | 25.7 % | 2 of 6 | 520 | 148 | 781 | 12 | 1,107 | 800 | 1 |
| Region II | Elevated | 23.8 % | 2 of 2 | 270 | 127 | 295 | 16 | 1,311 | 710 | 8 |
| Region III | Normal | 28.9 % | 3 of 6 | 1,223 | 196 | 461 | 265 | 624 | 1,351 | 9 |
| Region IV | Normal | 11.8 % | 2 of 8 | 808 | 98 | 169 | 33 | 1,754 | 1,190 | 6 |
| Region V | Normal | 32.8 % | 1 of 6 | 1,630 | 174 | 3,171 | 103 | 500 | 1,294 | 11 |
| Region VI | Normal | 10.2 % | 1 of 5 | 737 | 107 | 361 | 4 | 3,998 | 2,561 | 12 |
| Region VII | Normal | 12.4 % | 0 of 4 | 496 | 57 | 126 | 174 | 458 | 526 | 0 |
| Region VIII | Normal | 14.8 % | 1 of 6 | 469 | 208 | 373 | 53 | 1,444 | 491 | 6 |
| Region IX | Normal | 19.6 % | 3 of 4 | 1,045 | 600 | 356 | 13 | 1,007 | 649 | 13 |
| Region X | Elevated | 27.2 % | 0 of 4 | 367 | 277 | 154 | 18 | 333 | 659 | 1 |
* HHS regions (Region I: CT, ME, MA, NH, RI, VT; Region II: NJ, NY, Puerto Rico, US Virgin Islands; Region III: DE, DC, MD, PA, VA, WV; Region IV: AL, FL, GA, KY, MS, NC, SC, TN; Region V: IL, IN, MI, MN, OH, WI; Region VI: AR, LA, NM, OK, TX; Region VII: IA, KS, MO, NE;
Region VIII: CO, MT, ND, SD, UT, WY; Region IX: AZ, CA, Guam, HI, NV; and Region X: AK, ID, OR, WA)
?Elevated means the % of visits for ILI is at or above the national or region-specific baseline
?National data are for current week; regional data are for the most recent three weeks
?Includes all 50 states and the District of Columbia
?The majority of influenza A viruses that cannot be sub-typed as seasonal influenza viruses are novel A (H1N1) influenza viruses upon further testing
U.S. Virologic Surveillance:
WHO and NREVSS collaborating laboratories located in all 50 states and Washington D.C. report to CDC the number of respiratory specimens tested for influenza.
During the 2008-09 season, influenza A (H1), A (H3), and B viruses have co-circulated in the United States. On April 15 and 17, 2009, CDC confirmed that two cases of febrile respiratory illness occurring in children who reside in adjacent counties in southern California were caused by infection with a novel influenza A (H1N1) virus. As of June 5, 2009, 13,217 confirmed and probable infections with novel influenza A (H1N1) virus have been identified by CDC and state and local public health departments. Reporting of novel influenza A (H1N1) viruses by U.S. WHO collaborating laboratories began during week 17. The results of tests performed during the current week are summarized in the table below.
| Week 21 | |
|---|---|
| No. of specimens tested | 6,679 |
| No. of positive specimens (%) | 2,074 (31.1%) |
| Positive specimens by type/subtype | |
| Influenza A | 2,057 (99.2%) |
| A (H1) | 4 (0.2%) |
| A (H3) | 36 (1.8%) |
| A (unsubtyped) | 311 (15.1%) |
| A (could not be subtyped) | 148 (7.2%) |
| A (novel influenza H1N1) | 1,558 (75.7%) |
| Influenza B | 17 (0.8%) |
During week 21, seasonal influenza A (H1), A (H3), and B viruses continue to co-circulate at low levels with novel influenza A (H1N1). Approximately 82% of all influenza viruses being reported to CDC this week are novel influenza A (H1N1) viruses.
The increase in the percentage of specimens testing positive for influenza by WHO and NREVSS collaborating laboratories may be due in part to changes in testing practices by health care providers, triaging of specimens by public health laboratories, an increase in the number of specimens collected from outbreaks, and other factors.
View WHO-NREVSS Regional Bar Charts| View Chart Data | View Full Screen
Antigenic Characterization:
CDC has antigenically characterized 1,567 seasonal human influenza viruses [947 influenza A (H1), 162 influenza A (H3) and 458 influenza B viruses] collected by U.S. laboratories since October 1, 2008, and 84 novel influenza A (H1N1) viruses.
All 947 influenza seasonal A (H1) viruses are related to the influenza A (H1N1) component of the 2008-09 influenza vaccine (A/Brisbane/59/2007). All 162 influenza A (H3N2) viruses are related to the A (H3N2) vaccine component (A/Brisbane/10/2007).
All 84 novel influenza A (H1N1) viruses are related to the A/California/07/2009 (H1N1) reference virus selected by WHO as a potential candidate for novel influenza A (H1N1) vaccine.
Influenza B viruses currently circulating can be divided into two distinct lineages represented by the B/Yamagata/16/88 and B/Victoria/02/87 viruses. Sixty-one influenza B viruses tested belong to the B/Yamagata lineage and are related to the vaccine strain (B/Florida/04/2006). The remaining 397 viruses belong to the B/Victoria lineage and are not related to the vaccine strain.
Data on antigenic characterization should be interpreted with caution given that antigenic characterization data is based on hemagglutination inhibition (HI) testing using a panel of reference ferret antisera and results may not correlate with clinical protection against circulating viruses provided by influenza vaccination.
Annual influenza vaccination is expected to provide the best protection against those virus strains that are related to the vaccine strains, but limited to no protection may be expected when the vaccine and circulating virus strains are so different as to be from different lineages, as is seen with the two lineages of influenza B viruses. Antigenic characterization of novel influenza A (H1N1) viruses indicates that these viruses are antigenically and genetically unrelated to seasonal influenza A (H1N1) viruses, suggesting that little to no protection would be expected from vaccination with seasonal influenza vaccine.
Antiviral Resistance:
Since October 1, 2008, 930 seasonal influenza A (H1N1), 172 influenza A (H3N2), and 491 influenza B viruses have been tested for resistance to the neuraminidase inhibitors (oseltamivir and zanamivir). Nine hundred fifty-eight seasonal influenza A (H1N1) and 166 influenza A (H3N2) viruses have been tested for resistance to the adamantanes (amantadine and rimantadine). One hundred fifty-six novel influenza A (H1N1) viruses have been tested for resistance to the neuraminidase inhibitors (oseltamivir and zanamivir). One hundred twenty-five novel influenza A (H1N1) viruses have been tested for resistance to the adamantanes (amantadine and rimantadine). The results of antiviral resistance testing performed on these viruses are summarized in the table below.
| Isolates tested (n) | Resistant Viruses, Number (%) |
Isolates tested (n) | Resistant Viruses, Number (%) | ||
|---|---|---|---|---|---|
| Oseltamivir | Zanamivir | Adamantanes | |||
| Seasonal Influenza A (H1N1) | 930 | 925 (99.5%) | 0 (0) | 958 | 5 (0.5%) |
| Influenza A (H3N2) | 172 | 0 (0) | 0 (0) | 166 | 166 (100%) |
| Influenza B | 491 | 0 (0) | 0 (0) | N/A* | N/A* |
| Novel Influenza A (H1N1) | 156 | 0 (0) | 0 (0) | 125 | 125 (100%) |
Antiviral treatment with either oseltamivir or zanamivir is recommended for all patients with confirmed, probable or suspected cases of novel influenza A (H1N1) virus infection who are hospitalized or who are at higher risk for seasonal influenza complications. The novel influenza A (H1N1) virus is susceptible to both neuraminidase inhibitor antiviral medications zanamivir and oseltamivir. It is resistant to the adamantane antiviral medications, amantadine and rimantadine. Additional information on antiviral recommendations for treatment and chemoprophylaxis of novel influenza A (H1N1) infection is available at http://www.cy118119.com/h1n1flu/recommendations.htm
In areas that continue to have seasonal influenza activity, especially those with circulation of oseltamivir-resistant seasonal human influenza A (H1N1) viruses, clinicians might prefer to use either zanamivir or a combination of oseltamivir and either rimantadine or amantadine to provide adequate empiric treatment or chemoprophylaxis for patients who might have seasonal human influenza A (H1N1) virus infection.
Pneumonia and Influenza (P&I) Mortality Surveillance
During week 21, 6.3% of all deaths reported through the 122-Cities Mortality Reporting System were due to P&I. This percentage is below to the epidemic threshold of 7.1% for week 21.
View Full Screen
Influenza-Associated Pediatric Mortality
Five influenza-associated pediatric deaths were reported to CDC during week 21 (Arizona [2], California, Colorado, and Illinois). Three of these deaths were associated with confirmed infections with novel influenza A (H1N1) viruses; one was confirmed as seasonal influenza A (H1N1), and one was confirmed as an influenza A virus (subtype unknown). The deaths reported this week occurred between February 8, 2009 and May 26, 2009. Since September 28, 2008, CDC has received 67 reports of influenza-associated pediatric deaths that occurred during the current influenza season.
Of the 33 children who had specimens collected for bacterial culture from normally sterile sites, 14 (42.4%) were positive; Staphylococcus aureus was identified in nine (64.3%) of the 14 children. One of the three children with confirmed novel influenza A (H1N1) infection had a specimen collected from a normally sterile site; bacterial cultures were negative. Four of the S. aureus isolates were sensitive to methicillin and five were methicillin resistant. Twelve (85.7%) of the 14 children with bacterial coinfections were five years of age or older and 10 (71.4%) of the 14 children were 12 years of age or older. An increase in the number of influenza-associated pediatric deaths with bacterial coinfections was first recognized during the 2006-07 influenza season. In January 2008, interim testing and reporting recommendations were released regarding influenza and bacterial coinfections in children and are available at (http://www2a.cdc.gov/HAN/ArchiveSys/ViewMsgV.asp?AlertNum=00268).
View Full Screen
Influenza-Associated Hospitalizations
Laboratory-confirmed influenza-associated hospitalizations are monitored in two population-based surveillance networks: the New Vaccine Surveillance Network (NVSN) and the Emerging Infections Program (EIP).
During October 12, 2008 to May 16, 2009, the preliminary laboratory-confirmed influenza-associated hospitalization rate for children 0-4 years old in the NVSN was 3.85 per 10,000. Because of case identification methods utilized in this study, there is a delay from the date of hospitalization to the date of report.
View Full Screen
During April 15, 2009 ?May 30, 2009, the following preliminary laboratory-confirmed overall influenza associated hospitalization rates were reported by the EIP (rates include type A, type B, and confirmed Novel H1N1):
Rates for children aged 0-23 months, 2-4 years, 5-9 years, and 10-17 years were 0.5, 0.1, 0.1, and 0.1 per 10,000, respectively. Rates for adults aged 18-29 years, 30-49 years, and >= 50 years, the overall flu rates were 0.03, 0.04, and 0.1 per 10,000, respectively.
*This value represents an age group-specific average influenza rate from October 1 to April 30 from the 2005-06, 2006-07, and 2007-08 influenza seasons.
View Full Screen
Outpatient Illness Surveillance:
Nationwide during week 21, 2.0% of patient visits reported through the U.S. Outpatient Influenza-like Illness Surveillance Network (ILINet) were due to influenza-like illness (ILI). This percentage is below the national baseline of 2.4%.
View ILINet Regional Charts | View Chart Data |View Full Screen
On a regional level, the percentage of outpatient visits for ILI ranged from 0.6% to 6.0%. Three of the 10 surveillance regions reported an ILI percentage at or above their region specific baseline (Regions I, II and X). ILI increased during week 21 in six of 10 regions compared to week 20.
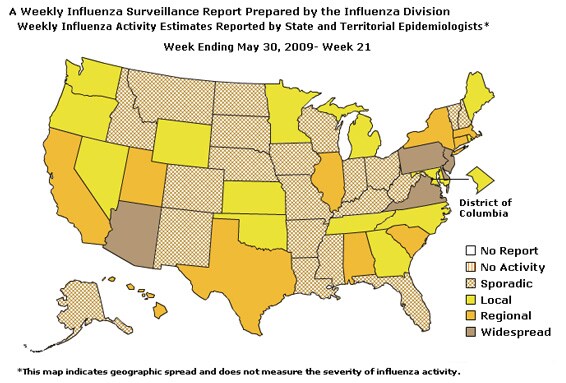
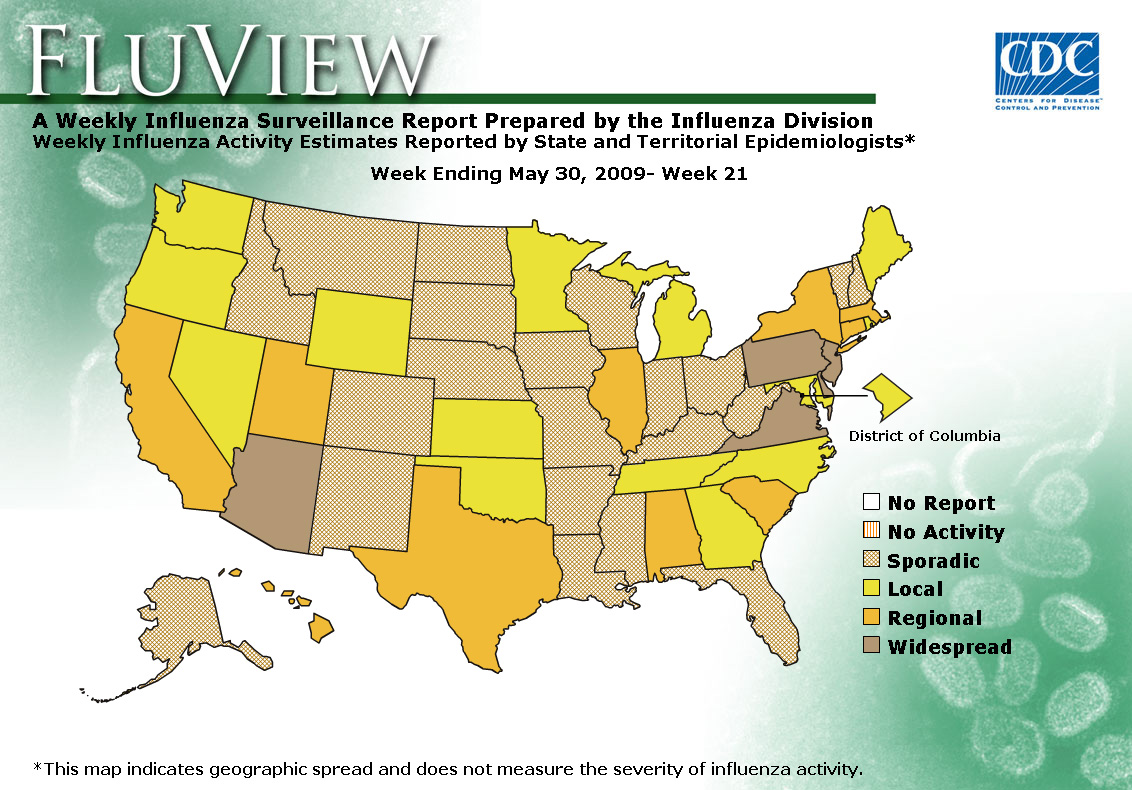
Geographic Spread of Influenza as Assessed by State and Territorial Epidemiologists:
The influenza activity reported by state and territorial epidemiologists indicates geographic spread of both seasonal influenza and novel influenza A (H1N1) viruses and does not measure the severity of influenza activity.
During week 21, the following influenza activity was reported:
- Widespread influenza activity was reported by five states (Arizona, Delaware, New Jersey, Pennsylvania, and Virginia).
- Regional influenza activity was reported by 10 states (Alabama, California, Connecticut, Hawaii, Illinois, Massachusetts, New York, South Carolina, Texas, and Utah).
- Local influenza activity was reported by the District of Columbia and 14 states (Georgia, Kansas, Maine, Maryland, Michigan, Minnesota, Nevada, North Carolina, Oklahoma, Oregon, Rhode Island, Tennessee, Washington, and Wyoming).
- Sporadic activity was reported by 21 states (Alaska, Arkansas, Colorado, Florida, Idaho, Indiana, Iowa, Kentucky, Louisiana, Mississippi, Missouri, Montana, Nebraska, New Hampshire, New Mexico, North Dakota, Ohio, South Dakota, Vermont, West Virginia, and Wisconsin).
--------------------------------------------------------------------------------
A description of surveillance methods is available at:
http://www.cy118119.com/flu/weekly/fluactivity.htm
- Page last updated June 5, 2009.