Error processing SSI file
Weekly Report: Influenza Summary Update
2008-2009 Influenza Season Week 17 ending May 2, 2009
(All data are preliminary and may change as more reports are received.)(Due to the response to the novel influenza A (H1N1) investigation, surveillance regions were changed from Census Divisions to Department of Health and Human Services (HHS) Regions.)
Synopsis:
During week 17 (April 26 - May 2, 2009), influenza activity increased in the United States.
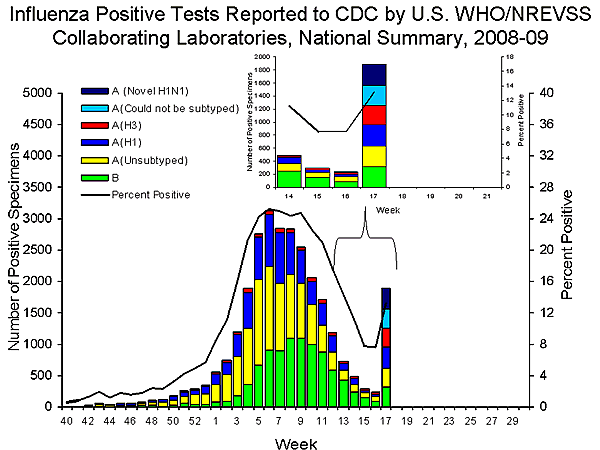
- One thousand eight hundred ninety-two (13.2%) specimens tested by U.S. World Health Organization (WHO) and National Respiratory and Enteric Virus Surveillance System (NREVSS) collaborating laboratories and reported to CDC/Influenza Division were positive for influenza.
- The proportion of deaths attributed to pneumonia and influenza (P&I) was below the epidemic threshold.
- No influenza-associated pediatric deaths were reported
- The proportion of outpatient visits for influenza-like illness (ILI) was 2.6% which is above the national baseline.
- Seven states reported widespread activity, 12 states reported regional activity, the District of Columbia and 14 states reported local influenza activity; and Puerto Rico and 17 states reported sporadic influenza activity.
U.S. Virologic Surveillance:
WHO and NREVSS collaborating laboratories located in all 50 states and Washington D.C. report to CDC the number of respiratory specimens tested for influenza.
During the 2008-09 season, influenza A (H1), A (H3), and B viruses have co-circulated in the United States. On April 17, 2009, CDC and the California Department of Public Health determined that two cases of febrile respiratory illness occurring in children who reside in adjacent counties in southern California were caused by infection with a novel influenza A (H1N1) virus. As of May 8, 2009, 1,639 confirmed infections with novel influenza A (H1N1) infections have been identified by CDC and state and local public health departments. Reporting of novel influenza A (H1N1) viruses by US WHO collaborating laboratories began during week 17 and are included in the table below.
During week 17, seasonal influenza A (H1), A (H3), and B viruses co-circulated with novel influenza A (H1N1). The relative proportion of influenza A (H3N2) viruses increased nationally and in six (Region I, II, VI, VIII, IX, and X) of the ten surveillance regions*.
The number of specimens tested by WHO and NREVSS collaborating laboratories during week 17 increased in response to the ongoing novel influenza A (H1N1) virus circulations and investigations. The increase in the percentage of specimens testing positive for influenza also may be due in part to changes in testing practices by healthcare providers, triaging of specimens by public health laboratories, an increase in the number of specimens collected from outbreaks, and other factors.
| Week 17 | |
|---|---|
| No. of specimens tested | 14,330 |
| No. of positive specimens (%) | 1,892 (13.2%) |
| Positive specimens by type/subtype | |
| Influenza A | 1,572 (83.1%) |
| A (H1) | 334 (21.3%) |
| A (H3) | 300 (19.1%) |
| A (unsubtyped) | 308 (19.6%) |
| A (could not be subtyped) | 304 (19.3%) |
| A (novel influenza H1N1) | 326 (20.7%) |
| Influenza B | 320 (16.9%) |
View Chart Data | View Full Screen
Antiviral Resistance:
Since October 1, 2008, 825 seasonal influenza A (H1N1), 132 influenza A (H3N2), and 403 influenza B viruses have been tested for resistance to the neuraminidase inhibitors (oseltamivir and zanamivir). Eight hundred thirty-two influenza A (H1N1) and 141 influenza A (H3N2) viruses have been tested for resistance to the adamantanes (amantadine and rimantadine). Sixty-eight novel influenza A (H1N1) viruses have been tested for resistance to the neuraminidase inhibitors (oseltamivir and zanamivir). Ninety-six novel influenza A (H1N1) viruses have been tested for resistance to the adamantanes (amantadine and rimantadine). The results of antiviral resistance testing performed on these viruses are summarized in the table below.
| Isolates tested (n) | Resistant Viruses, Number (%) |
Isolates tested (n) | Resistant Viruses, Number (%) | ||
|---|---|---|---|---|---|
| Oseltamivir | Zanamivir | Adamantanes | |||
| Seasonal Influenza A (H1N1) | 825 | 820 (99.4%) | 0 (0) | 832 | 4 (0.5%) |
| Influenza A (H3N2) | 132 | 0 (0) | 0 (0) | 141 | 141 (100%) |
| Influenza B | 403 | 0 (0) | 0 (0) | N/A* | N/A* |
| Novel Influenza A (H1N1) | 68 | 0 (0) | 0 (0) | 96 | 96 (100%) |
Antiviral treatment with either oseltamivir or zanamivir is recommended for all patients with confirmed, probable or suspected cases of novel influenza A (H1N1) virus infection who are hospitalized or who are at higher risk for seasonal influenza complications. The novel influenza A (H1N1) virus is susceptible to both neuraminidase inhibitor antiviral medications zanamivir and oseltamivir. It is resistant to the adamantane antiviral medications, amantadine and rimantadine. Additional information on antiviral recommendations for treatment and chemoprophylaxis of novel influenza A (H1N1) infection is available at http://www.cy118119.com/h1n1flu/recommendations.htm
In areas that continue to have seasonal influenza activity, especially those with circulation of oseltamivir-resistant seasonal human influenza A (H1N1) viruses, clinicians might prefer to use either zanamivir or a combination of oseltamivir and either rimantadine or amantadine to provide adequate empiric treatment or chemoprophylaxis for patients who might have seasonal human influenza A (H1N1) virus infection.
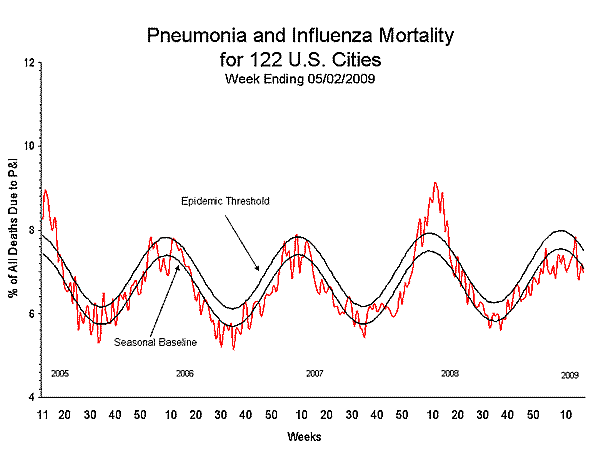
Pneumonia and Influenza (P&I) Mortality Surveillance
During week 17, 7.0% of all deaths reported through the 122-Cities Mortality Reporting System were due to P&I. This percentage is below to the epidemic threshold of 7.5% for week 17.
View Full Screen
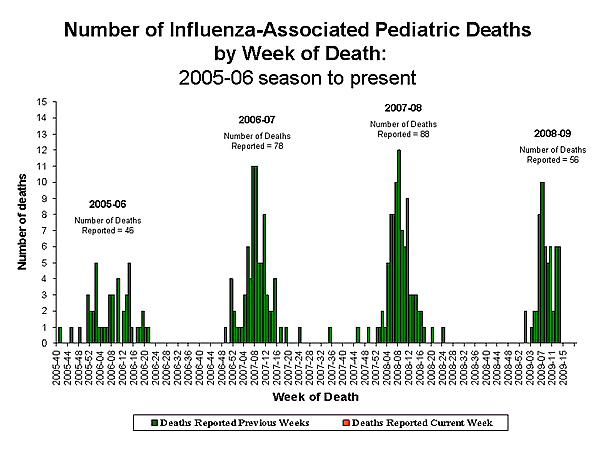
Influenza-Associated Pediatric Mortality
No influenza-associated pediatric deaths were reported to CDC during week 17. Since September 28, 2008, CDC has received 56 reports of influenza-associated pediatric deaths that occurred during the current season.
View Full Screen
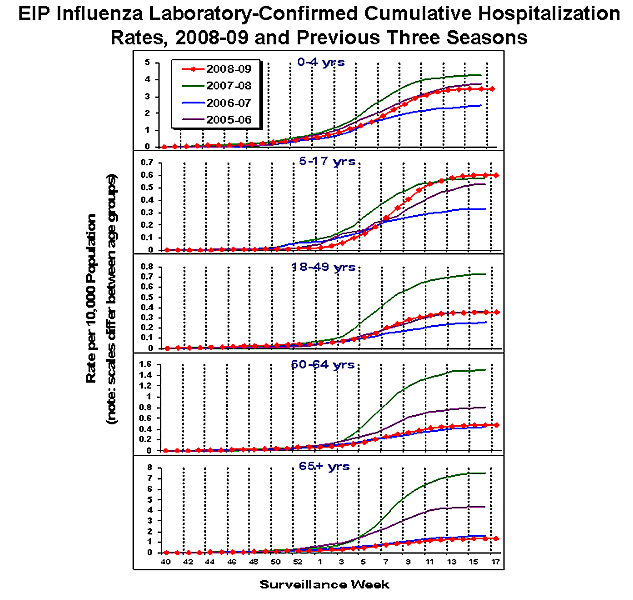
Influenza-Associated Hospitalizations
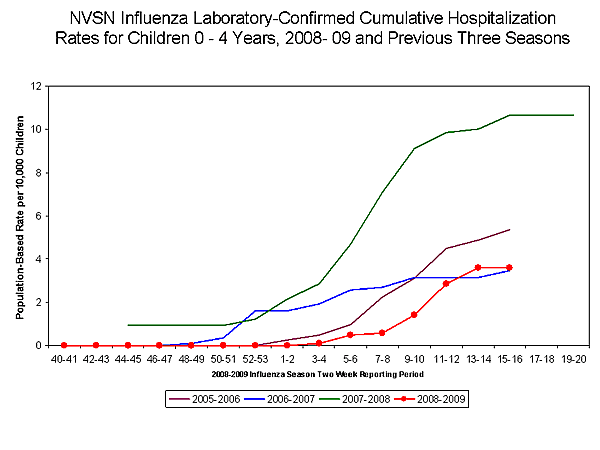
Laboratory-confirmed influenza-associated hospitalizations are monitored in two population-based surveillance networks: the New Vaccine Surveillance Network (NVSN) and the Emerging Infections Program (EIP). These two systems provide updates of surveillance data every two weeks.
During October 12, 2008 to May 2, 2009, the preliminary laboratory-confirmed influenza-associated hospitalization rate for children 0-4 years old in the NVSN was 3.8 per 10,000. Because of case identification methods utilized in this study, there is a delay from the date of hospitalization to the date of report.
View Full Screen
During October 1, 2008 ?May 2, 2009, preliminary laboratory-confirmed influenza-associated hospitalization rates reported by the EIP for children aged 0-4 years and 5-17 years were 3.5 per 10,000 and 0.6 per 10,000, respectively. For adults aged 18-49 years, 50-64 years, and = 65 years, the rates were 0.4 per 10,000, 0.5 per 10,000, and 1.3 per 10,000, respectively.
View Full Screen
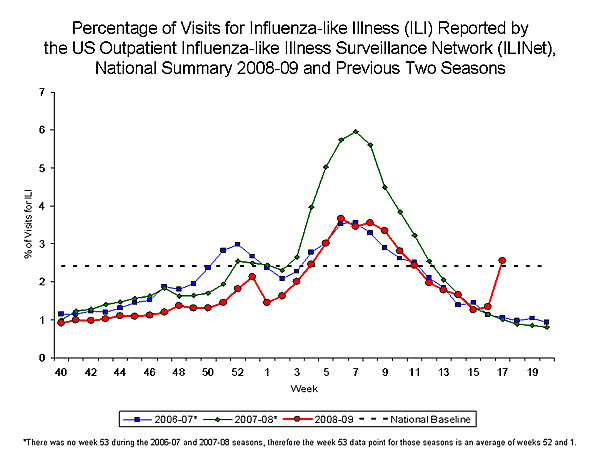
Outpatient Illness Surveillance:
Nationwide during week 17, 2.6% of patient visits reported through the U.S. Outpatient Influenza-like Illness Surveillance Network (ILINet) were due to influenza-like illness (ILI). This percentage is above the national baseline of 2.4%.
View Chart Data |View Full Screen
On a regional level, the percentage of visits for ILI ranged from 0.5% to 4.1%. Four of the ten surveillance regions reported an ILI percentage above their region specific baselines.
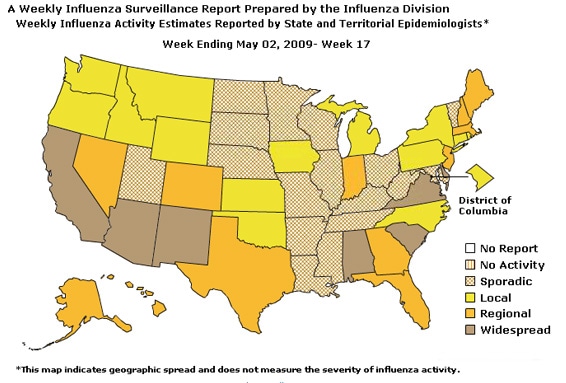
Geographic Spread of Influenza as Assessed by State and Territorial Epidemiologists:
The influenza activity reported by state and territorial epidemiologists indicates geographic spread of both seasonal influenza and novel influenza A (H1N1) viruses and does not measure the severity of influenza activity.
During week 17, the following influenza activity was reported:
- Widespread influenza activity was reported by seven states (Alabama, Arizona, California, Delaware, New Mexico, South Carolina, and Virginia).
- Regional influenza activity was reported by 12 states (Alaska, Colorado, Florida, Georgia, Hawaii, Indiana, Maine, Massachusetts, Nevada, New Hampshire, New Jersey, and Texas).
- Local influenza activity was reported by the District of Columbia and 14 states (Connecticut, Idaho, Iowa, Kansas, Michigan, Montana, New York, North Carolina, Oklahoma, Oregon, Pennsylvania, Rhode Island, Washington, and Wyoming).
- Sporadic activity was reported by Puerto Rico and 17 states (Arkansas, Illinois, Kentucky, Louisiana, Maryland, Minnesota, Mississippi, Missouri, Nebraska, North Dakota, Ohio, South Dakota, Tennessee, Utah, Vermont, West Virginia, and Wisconsin).
--------------------------------------------------------------------------------
A description of surveillance methods is available at:
http://www.cy118119.com/flu/weekly/fluactivity.htm
*HHS regions (Region I: CT, ME, MA, NH, RI, VT; Region II: NJ, NY, Puerto Rico, U.S. Virgin Islands; Region III: DE, DC, MD, PA, VA, WV; Region IV: AL, FL, GA, KY, MS, NC, SC, TN; Region V: IL, IN, MI, MN, OH, WI; Region VI: AR, LA, NM, OK, TX; Region VII: IA, KS, MO, NE; Region VIII: CO, MT, ND, SD, UT, WY; Region IX: AZ, CA, Guam, HI, NV; and Region X: AK, ID, OR, WA)
- Page last updated May 11, 2009.