Error processing SSI file
Weekly Report: Influenza Summary Update
2007-2008 Influenza Season Week 19, ending May 10, 2008
(All data are preliminary and may change as more reports are received.)Synopsis
During week 19 (May 4 ?10, 2008), influenza activity continued to decrease in the United States.
- Thirty-five (2.8%) specimens tested by U.S. World Health Organization (WHO) and National Respiratory and Enteric Virus Surveillance System (NREVSS) collaborating laboratories were positive for influenza.
- The proportion of deaths attributed to pneumonia and influenza has been above the epidemic threshold for 18 consecutive weeks.
- The proportion of outpatient visits for influenza-like illness (ILI) and the proportion of outpatient visits for acute respiratory illness (ARI) were below national baseline levels. ILI was at the region-specific baseline in one region (New England), while the proportion of outpatient visits reported for ARI was below all region and age-specific baselines.
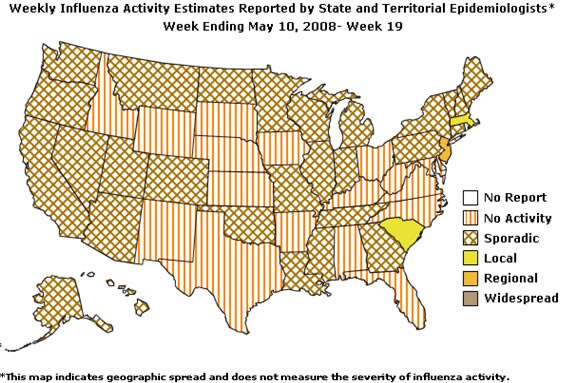
- One state reported regional influenza activity; two states reported local influenza activity; 28 states and Puerto Rico reported sporadic influenza activity; and 19 states and the District of Columbia reported no influenza activity.
Region |
Data for current week | Data cumulative for the season | |||||||
|---|---|---|---|---|---|---|---|---|---|
| Sentinel Provider ILI* | DoD and VA ARI* | % pos. for flu† | # jurisdictions reporting regional or widespread activity‡ | A (H1) | A (H3) | A Unsub-typed | B | Pediatric Deaths | |
| Nation | Normal | Normal | 2.8 % | 1 of 51 | 2173 | 6099 | 19819 | 11316 | 71 |
| New England | Elevated | Normal | 3.9 % | 0 of 6 | 97 | 260 | 1260 | 1343 | 8 |
| Mid-Atlantic | Normal | Normal | 4.0 % | 1 of 3 | 209 | 354 | 1955 | 1960 | 13 |
| East North Central | Normal | Normal | 8.2 % | 0 of 5 | 185 | 1430 | 630 | 599 | 9 |
| West North Central | Normal | Normal | 4.4 % | 0 of 7 | 107 | 251 | 3050 | 1786 | 6 |
| South Atlantic | Normal | Normal | 5.6 % | 0 of 9 | 352 | 1826 | 4789 | 1758 | 8 |
| East South Central | Normal | Normal | 1.3 % | 0 of 4 | 37 | 760 | 152 | 148 | 6 |
| West South Central | Normal | Normal | 2.9 % | 0 of 4 | 109 | 499 | 6044 | 1767 | 8 |
| Mountain | Normal | Normal | 2.6 % | 0 of 8 | 531 | 476 | 1006 | 1091 | 6 |
| Pacific | Normal | Normal | 6.6 % | 0 of 5 | 546 | 243 | 933 | 864 | 7 |
* Elevated means the % of visits for ILI or ARI is at or above the national or
region-specific baseline
?National data is for current week; regional data is for the most recent 3 weeks.
?Includes all 50 states and the District of Columbia
Laboratory Surveillance
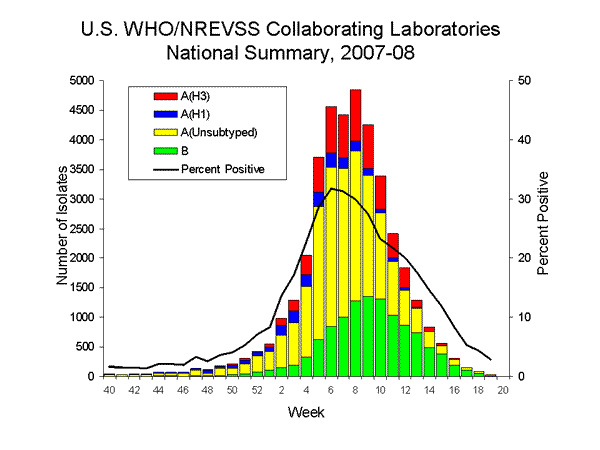
During week 19, WHO and NREVSS laboratories reported 1,237 specimens tested for influenza viruses, 35 (2.8%) of which were positive, including 15 influenza A viruses that were not subtyped and 20 influenza B viruses.
Since September 30, 2007, WHO and NREVSS laboratories have tested a total of 218,493 specimens for influenza viruses and 39,407 (18.0%) were positive. Among the 39,407 influenza viruses, 28,091 (71.3%) were influenza A viruses and 11,316 (28.7%) were influenza B viruses. Eight thousand two hundred seventy-two (29.4%) of the 28,091 influenza A viruses have been subtyped: 2,173 (26.3%) were influenza A (H1) viruses and 6,099 (73.7%) were influenza A (H3) viruses.
During the 2007-08 season, influenza A (H1), A (H3), and B viruses have co-circulated in the United States. Influenza A (H3) viruses have predominated during the season overall; however, the most commonly reported influenza virus has varied by week. From week 40 through week 3 (September 30, 2007 ?January 19, 2008) influenza A (H1) viruses were more frequently reported; from week 4 through week 12 (January 20 ?March 22, 2008), influenza A (H3) viruses were more commonly reported; and from weeks 13 through 19 (March 23 ?May 10, 2008), more influenza B than influenza A viruses were reported. The predominant virus has also varied by region. Influenza A (H3) viruses have been reported more frequently than A (H1) viruses in seven of the nine surveillance regions (East North Central, East South Central, Mid-Atlantic, New England, South Atlantic, West North Central, and West South Central), while influenza A (H1) viruses have predominated this season in two regions (Mountain and Pacific).
View WHO-NREVSS Regional Bar Charts | View Chart Data | View Full Screen
Composition of the 2008-09 Influenza Vaccine:
WHO and FDA have recommended that the 2008-09 trivalent influenza vaccine for the Northern Hemisphere contain A/Brisbane/59/2007-like (H1N1), A/Brisbane/10/2007-like (H3N2), and B/Florida/4/2006-like viruses. All three components have been changed from the 2007-08 Northern Hemisphere vaccine formulation. A/Brisbane/10/2007-like (H3N2) and B/Florida/4/2006-like viruses are currently included in the 2008 Southern Hemisphere vaccines. This recommendation was based on surveillance data related to epidemiology and antigenic characteristics, serological responses to 2007-08 vaccines, and the availability of candidate strains and reagents.
Antigenic Characterization:
CDC has antigenically characterized 881 influenza viruses [381 influenza A (H1N1), 280 influenza A (H3N2), and 220 influenza B viruses] collected by U.S. laboratories since September 30, 2007.
Influenza A (H1N1) [381]
- Two hundred sixty-one (69%) of the 381 viruses were characterized as A/Solomon Islands/3/2006-like, the influenza A (H1N1) component of the 2007-08 influenza vaccine for the Northern Hemisphere and the 2008 influenza A (H1N1) component for the Southern Hemisphere.
- Twenty (5%) of the 381 viruses showed somewhat reduced titers with antisera produced against A/Solomon Islands/3/2006.
- One hundred (26%) of the 381 viruses were characterized as A/Brisbane/59/2007-like. A/Brisbane/59/2007 is a recent genetic/antigenic variant which evolved from A/Solomon Islands/03/2006. An A/Brisbane/59/2007-like virus is the WHO recommended strain for the 2008-09 Northern Hemisphere vaccine formulation.
Influenza A (H3N2) [280]
- Fifty-nine (21%) of the 280 viruses were characterized as A/Wisconsin/67/2005-like, the influenza A (H3N2) component of the 2007-08 influenza vaccine for the Northern Hemisphere.
- One hundred eighty-two (65%) of the 280 viruses were characterized as A/Brisbane/10/2007-like. A/Brisbane/10/2007-like viruses are a recent antigenic variant which evolved from, but are antigenically distinct from, A/Wisconsin/67/2005-like viruses. A/Brisbane/10/2007-like virus is the recommended influenza A (H3N2) component for the 2008 Southern Hemisphere and 2008-09 Northern Hemisphere vaccines.
- Thirty-nine (14%) of the 280 viruses showed somewhat reduced titers with antisera produced against A/Wisconsin/67/2005 and A/Brisbane/10/2007.
Influenza B (B/Victoria/02/87 and B/Yamagata/16/88 lineages) [220]Victoria lineage [8]
- Eight (4%) of the 220 influenza B viruses characterized belong to the B/Victoria lineage of viruses.
o Six (75%) of these 8 viruses were characterized as B/Ohio/01/2005-like. The recommended influenza B component for the 2007-08 influenza vaccine is a B/Malaysia/2506/2004-like virus, belonging to the B/Victoria lineage. B/Ohio/01/2005 is a recent B/Malaysia/2506/2004-like reference strain.
o Two (25%) of these 8 viruses showed somewhat reduced titers with antisera produced against B/Ohio/01/2005 and B/Malaysia/2506/2004.
Yamagata lineage [212]
- Two hundred twelve (96%) of the 220 influenza B viruses characterized belong to the B/Yamagata lineage of viruses.
o Two hundred three (96%) of these 212 viruses were identified as B/Florida/04/2006-like, the recommended influenza B component for the 2008-09 Northern Hemisphere vaccine formulation.
o Nine (4%) of these 212 viruses showed a somewhat reduced titer with antiserum produced against B/Florida/04/2006.
These data indicate similarities and differences between a sample of circulating strains and this year's vaccine strains as determined by laboratory studies. Interim results from a study carried out with the Marshfield Clinic in Wisconsin found vaccine effectiveness of 58% against circulating influenza A (H3N2) viruses, based on data collected from Jan 21 through Feb 8, 2008. No vaccine effectiveness against influenza B viruses was found. No influenza A (H1N1) viruses were identified through Feb 8 and, thus, no vaccine effectiveness estimate is available for H1N1 viruses. These interim results suggest that vaccination provided substantial protection against H3N2 influenza-associated medically attended illness in the study population. Enrollment in this study concluded on March 28, 2008, and final results will be available later this year. Additional information on this study can be found at: http://www.cy118119.com/mmwr/preview/mmwrhtml/mm5715a1.htm
Antiviral Resistance:
In the United States, two groups of antiviral drugs have been approved by FDA for use in treating or preventing influenza virus infections. These two groups of antiviral drugs are: neuraminidase inhibitors (oseltamivir and zanamivir) and adamantanes (amantadine and rimantadine). A description of these drugs can be found at: http://www.cy118119.com/flu/protect/antiviral/index.htm.
Neuraminidase Inhibitor Antiviral Drugs: So far this season, 1,591 influenza A and B viruses from the United States have been tested for antiviral resistance. One hundred six (8.1%) of 1,301 influenza A viruses tested, and 0 (0.0%) of 290 influenza B viruses tested have been found to be resistant to oseltamivir. Currently all of the resistant viruses are influenza A (H1N1) viruses, with 106 (10.9%) of 969 influenza A (H1N1) viruses tested exhibiting a genetic mutation that confers oseltamivir resistance. All tested viruses retain their sensitivity to zanamivir. Additional information on antiviral resistance can be found at: http://www.cy118119.com/flu/about/qa/antiviralresistance.htm
Adamantane Antiviral Drugs: Resistance to the adamantanes continues to be high among influenza A (H3N2) viruses with 388 (99.7%) of 389 influenza A (H3N2) viruses tested resistant to the adamantanes. Adamantane resistance among influenza A (H1N1) viruses has also been detected but at a lower level. Of 872 influenza A (H1N1) viruses tested, 90 (10.3%) were resistant to the adamantanes. The adamantanes are not effective against influenza B viruses. Influenza A (H3N2) viruses have predominated in the United States during the 2007-08 season. Among influenza A viruses subtyped during the most recent three weeks (April 20 ?May 10, 2008), 58.3% were influenza A (H3N2).
Based on the level of oseltamivir resistance observed in only one influenza subtype, H1N1, persisting high levels of resistance to the adamantanes in H3N2 viruses, and the predominance of H3N2 viruses circulating in the United States during the 2007-08 season with co-circulation of influenza B viruses, CDC continues to recommend the use of oseltamivir and zanamivir for the treatment or prevention of influenza. Use of amantadine or rimantadine is not recommended. Guidance on influenza antiviral use can be found at: http://www.cy118119.com/mmwr/preview/mmwrhtml/rr5606a1.htm
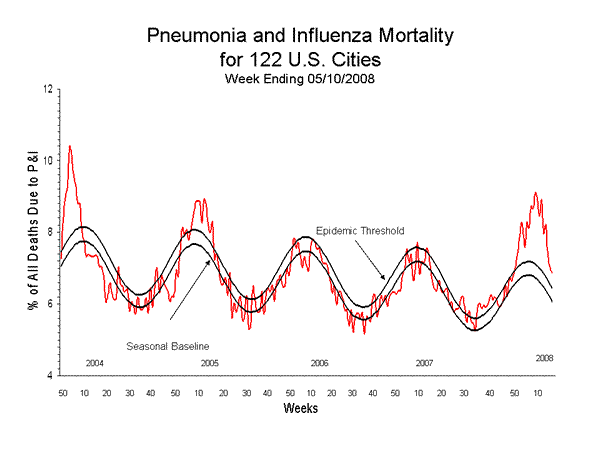
Pneumonia and Influenza (P&I) Mortality Surveillance
During week 19, 6.9% of all deaths reported through the 122 Cities Mortality Reporting System were reported as due to P&I. This percentage is above the epidemic threshold of 6.4% for week 19. Including week 19, P&I mortality has been above epidemic threshold for 18 consecutive weeks.
View Full Screen
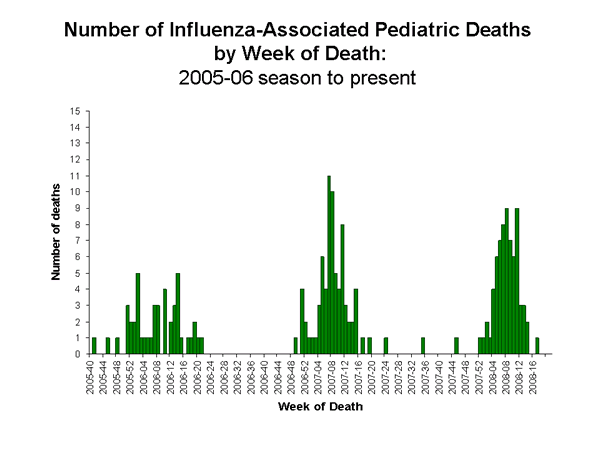
Influenza-Associated Pediatric Mortality
Three influenza-associated pediatric deaths were reported to CDC during week 19 (FL [2] and MI [1]). Two deaths occurred during the 2007-08 season, one during week 13 (March 23-29, 2008) and the other during week 17 (April 20-26, 2008). One death occurred during the 2006-07 season bringing the total number of cases occurring during that season to 76. Since September 30, 2007, CDC has received a total of 71 reports of influenza-associated pediatric deaths that occurred during the current season.
View Full Screen
Influenza-Associated Pediatric Hospitalizations
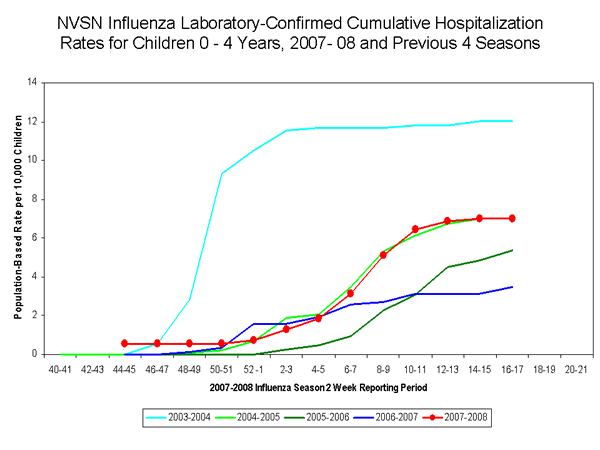
Laboratory-confirmed influenza-associated pediatric hospitalizations are monitored in two population-based surveillance networks: the New Vaccine Surveillance Network (NVSN) and the Emerging Infections Program (EIP). These two systems provide updates of surveillance data every two weeks. As a result of differing dates for initiating surveillance in the 2007-08 season, these updates occur on alternating weeks.
During November 4, 2007 to May 3, 2008, the preliminary laboratory-confirmed influenza-associated hospitalization rate for children 0-4 years old in the NVSN was 7.00 per 10,000.
View Full Screen
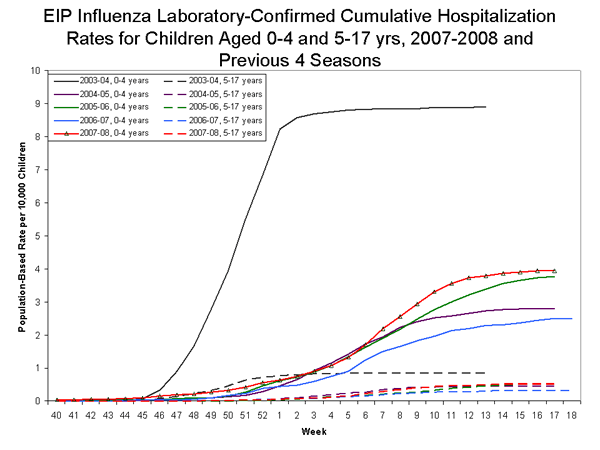
During September 30, 2007 ?April 26, 2008, the preliminary laboratory-confirmed influenza-associated hospitalization rate reported by the EIP for children 0?7 years old was 1.50 per 10,000. For children aged 0-4 years and 5-17 years, the rate was 3.94 per 10,000 and 0.52 per 10,000, respectively.
View Full Screen
Outpatient Illness Surveillance
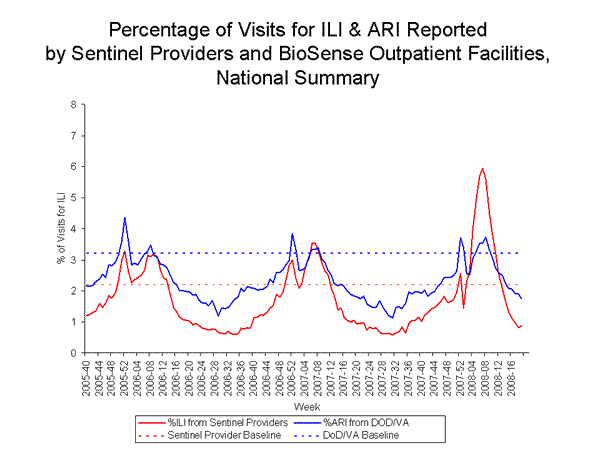
Nationwide during week 19, 0.9% of outpatient visits reported through the U.S. Influenza Sentinel Provider Surveillance Network were due to influenza-like illness (ILI), which was below the national baseline of 2.2%. On a regional level, the percentage of outpatient visits for ILI ranged from 0.3% to 1.8%. The New England region reported ILI at its region specific baseline, while the remaining eight regions (East North Central, East South Central, Mid-Atlantic, Mountain, Pacific, South Atlantic, West North Central, and West South Central) reported ILI below their region-specific baselines.
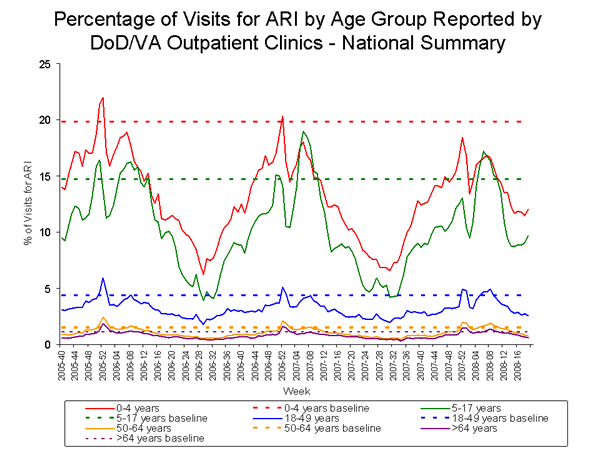
During week 19, 1.7% of patient visits to Department of Veterans Affairs (VA) and Department of Defense (DoD) outpatient treatment facilities were for acute respiratory illness (ARI), which was below the national baseline of 3.2%. On a regional level, the percentage of visits for ARI ranged from 0.9% to 2.3%, and was below region-specific baselines in all nine regions. All five age groups reported ARI below their age-specific baselines.
View Sentinel Providers Regional Charts | View Chart Data |View Full Screen
View Full Screen
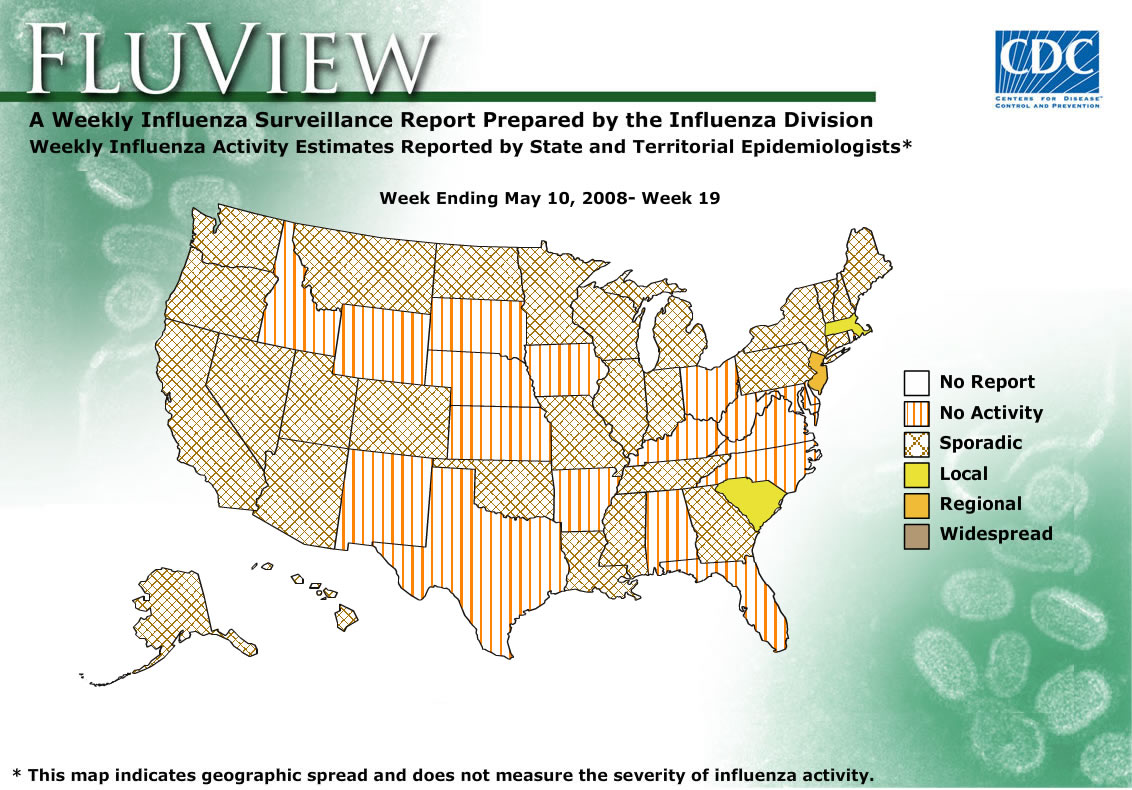
Geographic Spread of Influenza as Assessed by State and Territorial Epidemiologists
During week 19 the following influenza activity was reported:
- Regional influenza activity was reported by one state (New Jersey).
- Local influenza activity was reported by two states (Massachusetts and South Carolina).
- Sporadic influenza activity was reported by Puerto Rico and 28 states (Alaska, Arizona, California, Colorado, Connecticut, Georgia, Hawaii, Illinois, Indiana, Louisiana, Maine, Michigan, Minnesota, Mississippi, Missouri, Montana, Nevada, New Hampshire, New York, North Dakota, Oklahoma, Oregon, Pennsylvania, Tennessee, Utah, Vermont, Washington, and Wisconsin).
- No influenza activity was reported by the District of Columbia and 19 states (Alabama, Arkansas, Delaware, Florida, Idaho, Iowa, Kansas, Kentucky, Maryland, Nebraska, New Mexico, North Carolina, Ohio, Rhode Island, South Dakota, Texas, Virginia, West Virginia, and Wyoming).
--------------------------------------------------------------------------------
A description of surveillance methods is available at: http://www.cy118119.com/flu/weekly/fluactivity.htm
- Page last updated May 16, 2008. Error processing SSI file