Error processing SSI file
Weekly Report: Influenza Summary Update
2007-2008 Influenza Season Week 7, ending February 16, 2008
(All data are preliminary and may change as more reports are received.)Synopsis
During week 7 (February 10 - 16, 2008), influenza activity continued to increase in the United States.
- Two thousand three hundred forty (34.0%) specimens tested by U.S. World Health Organization (WHO) and National Respiratory and Enteric Virus Surveillance System (NREVSS) collaborating laboratories were positive for influenza.
- The proportion of deaths attributed to pneumonia and influenza was above the epidemic threshold for the sixth consecutive week.
- The proportion of outpatient visits for influenza-like illness (ILI) and acute respiratory illness (ARI) was above national baseline levels. ILI increased in six of the nine regions compared to week 6, and was above region-specific baselines in all nine regions. All nine regions reported ARI at or above their region specific baselines.
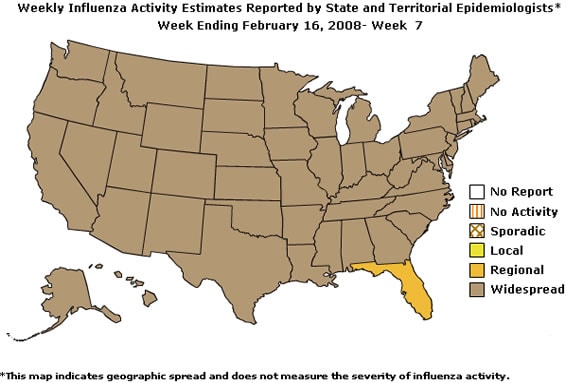
- Forty-nine states reported widespread influenza activity; one state reported regional influenza activity; and the District of Columbia reported local influenza activity.
Region |
Data for current week | Data cumulative for the season | |||||||
|---|---|---|---|---|---|---|---|---|---|
| Sentinel Provider ILI* | DoD and VA ARI* | % pos. for flu† | # jurisdictions reporting regional or widespread activity‡ | A (H1) | A (H3) | A Unsub-typed | B | Pediatric Deaths | |
| Nation | Elevated | Elevated | 34.0 % | 50 of 51 | 1266 | 2156 | 8956 | 2457 | 22 |
| New England | Elevated | Elevated | 22.4 % | 6 of 6 | 34 | 17 | 293 | 235 | 0 |
| Mid-Atlantic | Elevated | Elevated | 21.7 % | 3 of 3 | 57 | 20 | 339 | 379 | 3 |
| East North Central | Elevated | Elevated | 50.1 % | 5 of 5 | 119 | 532 | 347 | 223 | 3 |
| West North Central | Elevated | Elevated | 26.3 % | 7 of 7 | 62 | 65 | 851 | 182 | 0 |
| South Atlantic | Elevated | Elevated | 31.8 % | 8 of 9 | 191 | 676 | 2119 | 424 | 1 |
| East South Central | Elevated | Elevated | 42.9 % | 4 of 4 | 21 | 301 | 22 | 14 | 4 |
| West South Central | Elevated | Elevated | 34.9 % | 4 of 4 | 86 | 304 | 3999 | 472 | 7 |
| Mountain | Elevated | Elevated | 27.7 % | 8 of 8 | 325 | 172 | 567 | 346 | 2 |
| Pacific | Elevated | Elevated | 17.5 % | 5 of 5 | 371 | 69 | 419 | 182 | 2 |
* Elevated means the % of visits for ILI or ARI is at or above the national or
region-specific baseline
?National data is for current week; regional data is for the most recent 3 weeks.
?Includes all 50 states and the District of Columbia
Laboratory Surveillance
During week 7, WHO and NREVSS laboratories reported 6,889 specimens tested for influenza viruses, 2,340 (34.0%) of which were positive, including 47 influenza A (H1) viruses, 379 influenza A (H3) viruses, 1,432 influenza A viruses that were not subtyped, and 482 influenza B viruses.
Since September 30, 2007, WHO and NREVSS laboratories have tested a total of 109,089 specimens for influenza viruses and 14,835 (13.6%) were positive. Among the 14,835 influenza viruses, 12,378 (83.4%) were influenza A viruses and 2,457 (16.6%) were influenza B viruses. Three thousand four hundred twenty-two (27.6%) of the 12,378 influenza A viruses have been subtyped: 1,266 (37.0%) were influenza A (H1) viruses and 2,156 (63.0%) were influenza A (H3) viruses.
Although influenza A (H1) viruses predominated through mid-January, an increasing proportion of subtyped influenza A viruses are influenza A (H3) viruses. Influenza A (H3) viruses were reported more frequently than influenza A (H1) viruses during January 20February 9. During week 6, influenza A (H3) became the predominant virus for the season overall. This season influenza A (H3) viruses have been reported more frequently than A (H1) viruses nationally, as well as in five of the nine surveillance regions (East North Central, East South Central, South Atlantic, West North Central, and West South Central). Influenza A (H1) viruses have predominated circulation this season in the remaining four regions (Mid-Atlantic, Mountain, New England, and Pacific).
View WHO-NREVSS Regional Bar Charts | View Chart Data | View Full Screen
Antigenic Characterization:
CDC has antigenically characterized 280 influenza viruses [141 influenza A (H1N1), 70 influenza A (H3N2), and 69 influenza B viruses] collected by U.S. laboratories since September 30, 2007.
Influenza A (H1) [141]
- One hundred twenty-four (88%) of the 141 viruses were characterized as A/Solomon Islands/3/2006, the influenza A (H1N1) component of the 2007-08 influenza vaccine for the Northern Hemisphere and the 2008 influenza A (H1N1) component for the Southern Hemisphere.
- Seventeen (12%) of the 141 viruses showed somewhat reduced titers with antisera produced against A/Solomon Islands/3/2006.
Influenza A (H3) [70]
- Twelve (17%) of the 70 viruses were characterized as A/Wisconsin/67/2005-like, the influenza A (H3N2) component of the 2007-08 influenza vaccine for the Northern Hemisphere.
- Fifty-five (79%) of the 70 viruses were characterized as A/Brisbane/10/2007-like. A/Brisbane/10/2007-like viruses are a recent antigenic variant which evolved from, but are antigenically distinct from, A/Wisconsin/67/2005-like. A/Brisbane/10/2007-like virus is the recommended influenza A (H3N2) component for the 2008 Southern Hemisphere vaccine.
- Three (4%) of the 70 viruses showed somewhat reduced titers with antisera produced against A/Wisconsin/67/2005 and A/Brisbane/10/2007.
Influenza B (B/Victoria/02/87 and B/Yamagata/16/88 lineages) [69]Victoria lineage [4]
- Four (6%) of the 69 influenza B viruses characterized belong to the B/Victoria lineage of viruses.
o Two (50%) of these 4 viruses were characterized as B/Ohio/01/2005-like. The recommended influenza B component for the 2007-08 influenza vaccine is a B/Malaysia/2506/2004-like virus, belonging to the B/Victoria lineage. B/Ohio/01/2005 is a recent B/Malaysia/2506/2004-like reference strain.
o Two (50%) of these 4 viruses showed somewhat reduced titers with antisera produced against B/Ohio/01/2005 and B/Malaysia/2506/2004.Yamagata lineage [65]
- Sixty-five (94%) of the 69 viruses were identified as belonging to the B/Yamagata lineage of viruses.
Antiviral Resistance:
In the United States, two groups of antiviral drugs have been approved by FDA for use in treating or preventing influenza infections. These two groups of antiviral drugs are: neuraminidase inhibitors (oseltamivir and zanamivir) and adamantanes (amantadine and rimantidine). A description of these drugs can be found at: http://www.cy118119.com/flu/protect/antiviral/index.htm.
Neuraminidase Inhibitor Antiviral Drugs: Small numbers of influenza viruses resistant to the neuraminidase inhibitor oseltamivir have been detected in the United States. Of the 471 influenza A and B viruses tested for antiviral resistance so far this season, 27 (5.7%) have been found to be resistant to oseltamivir. Currently all of the resistant viruses are H1N1 viruses, with 27 (8.7%) of all H1N1 viruses exhibiting a genetic mutation that confers oseltamivir resistance. All tested viruses retain their sensitivity to zanamivir. Additional information on antiviral resistance can be found at: http://www.cy118119.com/flu/about/qa/antiviralresistance.htm
Adamantane Antiviral Drugs: Resistance to the adamantanes continues to be high. Among 282 influenza A viruses tested, 88 (31.2%) are resistant to adamantanes, including 98.6% of H3N2 viruses and 7.2% of H1N1 viruses. The adamantanes are not effective against influenza B viruses: http://www.cy118119.com/mmwr/preview/mmwrhtml/rr5606a1.htm
Based on the level of oseltamivir resistance observed in only one influenza subtype, H1N1, and persisting high levels of resistance to the adamantanes in both H3N2 and H1N1 viruses, CDC continues to recommend the use of oseltamivir and zanamivir for the treatment or prevention of influenza. Use of amantadine or rimantadine is not recommended. Guidance on influenza antiviral use can be found at: http://www.cy118119.com/mmwr/preview/mmwrhtml/rr5606a1.htm
Pneumonia and Influenza (P&I) Mortality Surveillance
During week 7, 8.2% of all deaths reported through the 122 Cities Mortality Reporting System were reported as due to P&I. This percentage is above the epidemic threshold of 7.2% for week 7. Including week 7, P&I mortality has been above threshold for six consecutive weeks.
View Full Screen
Influenza-Associated Pediatric Mortality
Twelve influenza-associated pediatric deaths were reported to CDC during week 7 from ten states [AR, CA, CO(2), FL, IL, IN, MS, NYC, TX(2), and WI]. Since September 30, 2007, CDC has received a total of 22 reports of influenza-associated pediatric deaths that occurred during the current season.
View Full Screen
Influenza-Associated Pediatric Hospitalizations
Laboratory-confirmed influenza-associated pediatric hospitalizations are monitored in two population-based surveillance networks: the New Vaccine Surveillance Network (NVSN) and the Emerging Infections Program (EIP).
During November 4, 2007-February 9, 2008, the preliminary laboratory-confirmed influenza-associated hospitalization rate reported by the NVSN for children 0-4 years old was 1.83 per 10,000.
During September 30 ?February 2, 2008, the preliminary laboratory-confirmed influenza-associated hospitalization rate reported by the EIP for children 0?7 years old was 0.36 per 10,000. For children aged 0-4 years and 5-17 years, the rate was 1.0 per 10,000 and 0.1 per 10,000, respectively.
View Full Screen
Outpatient Illness Surveillance
Nationwide during week 7, 6.4% of outpatient visits reported through the U.S. Influenza Sentinel Provider Surveillance Network were due to influenza-like illness (ILI), which is above the national baseline of 2.2%. On a regional level, the percentage of visits for ILI increased in six of the nine regions compared to last week and ranged from 4.1% to 10.1%. All nine regions reported ILI above their region-specific baselines.
Starting in week 5, New York City began reporting ILI data collected electronically from emergency departments city-wide, adding approximately 60,000 additional patient visits per week to the U.S. Influenza Sentinel Provider Surveillance Network. Retrospective reports were submitted for all earlier weeks this season. While this change increases the total patient visits per week by approximately 15%, it is not expected to influence the national ILI outpatient visit percentage after population weighting, but may have a larger impact on the Mid-Atlantic regional ILI percentage.
During week 7, 3.7% of patient visits to Department of Veterans Affairs (VA) and Department of Defense (DoD) outpatient treatment facilities were for acute respiratory illness (ARI), which was above the national baseline of 3.2%. On a regional level, the percentage of visits for ARI ranged from 1.8% to 4.3%, and was at or above the region-specific baselines in all nine regions. The percentage of visits reported for ARI was at or above age-specific baselines in the 5-17 years, 18-49 years, 50-64 years, and >64 years age groups.
View Sentinel Providers Regional Charts | View Chart Data |View Full Screen
View Full Screen
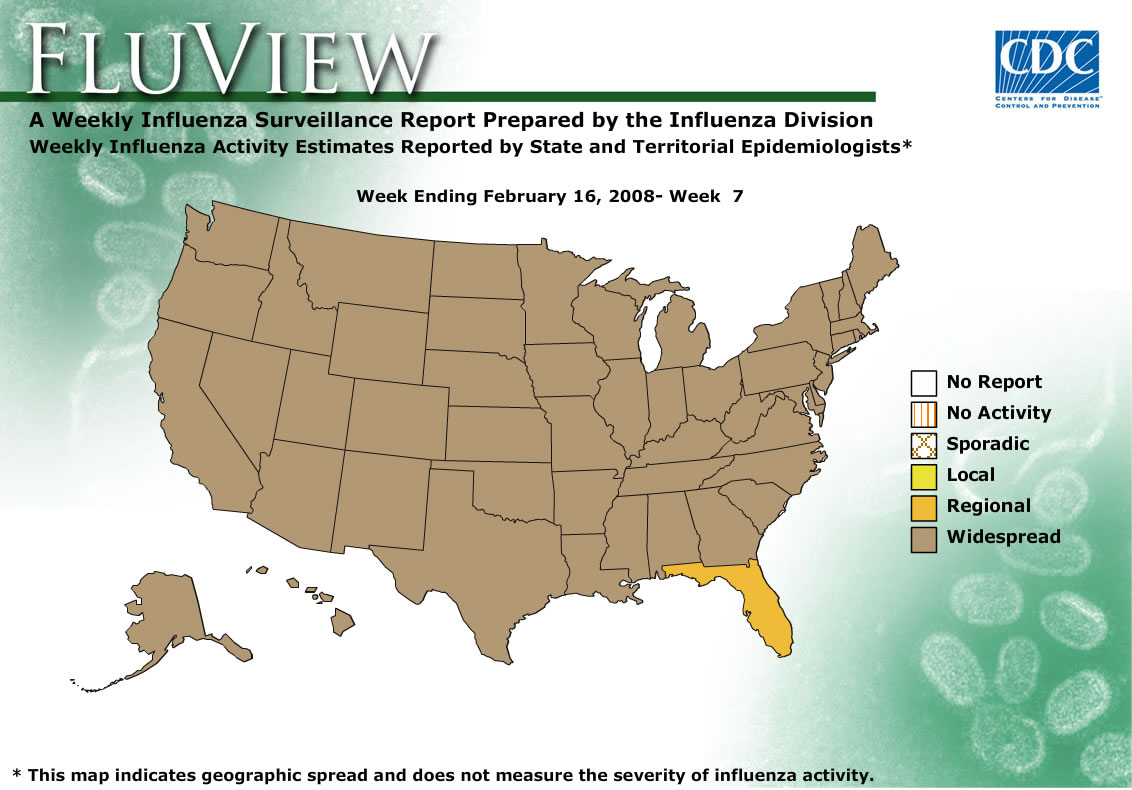
Geographic Spread of Influenza as Assessed by State and Territorial Epidemiologists
During week 7 the following influenza activity was reported:
- Widespread activity was reported by 49 states (Alabama, Alaska, Arizona, Arkansas, California, Colorado, Connecticut, Delaware, Georgia, Hawaii, Idaho, Illinois, Indiana, Iowa, Kansas, Kentucky, Louisiana, Maine, Maryland, Massachusetts, Michigan, Minnesota, Mississippi, Missouri, Montana, Nebraska, Nevada, New Hampshire, New Jersey, New Mexico, New York, North Carolina, North Dakota, Ohio, Oklahoma, Oregon, Pennsylvania, Rhode Island, South Carolina, South Dakota, Tennessee, Texas, Utah, Vermont, Virginia, Washington, Wisconsin, West Virginia, and Wyoming).
- Regional activity was reported by 1 state (Florida).
- The District of Columbia reported local influenza activity.
--------------------------------------------------------------------------------
A description of surveillance methods is available at: http://www.cy118119.com/flu/weekly/fluactivity.htm
- Page last updated February 22, 2008. Error processing SSI file