Error processing SSI file
Weekly Report: Influenza Summary Update
2007-2008 Influenza Season Week 4, ending January 26, 2008
(All data are preliminary and may change as more reports are received.)Synopsis
During week 4 (January 20 - 26, 2008), influenza activity continued to increase in the United States.
- Six hundred seventy-seven (16.8%) specimens tested by U.S. World Health Organization (WHO) and National Respiratory and Enteric Virus Surveillance System (NREVSS) collaborating laboratories were positive for influenza.
- The proportion of deaths attributed to pneumonia and influenza was above the epidemic threshold.
- The proportion of outpatient visits for influenza-like illness (ILI) was above national baseline levels, and the proportion of outpatient visits for acute respiratory illness (ARI) was below national baseline levels. ILI increased in all nine regions compared to week 3, and the East North Central, East South Central, Mountain, New England, Pacific, South Atlantic, West North Central, and West South Central regions reported ILI above their region-specific baselines.
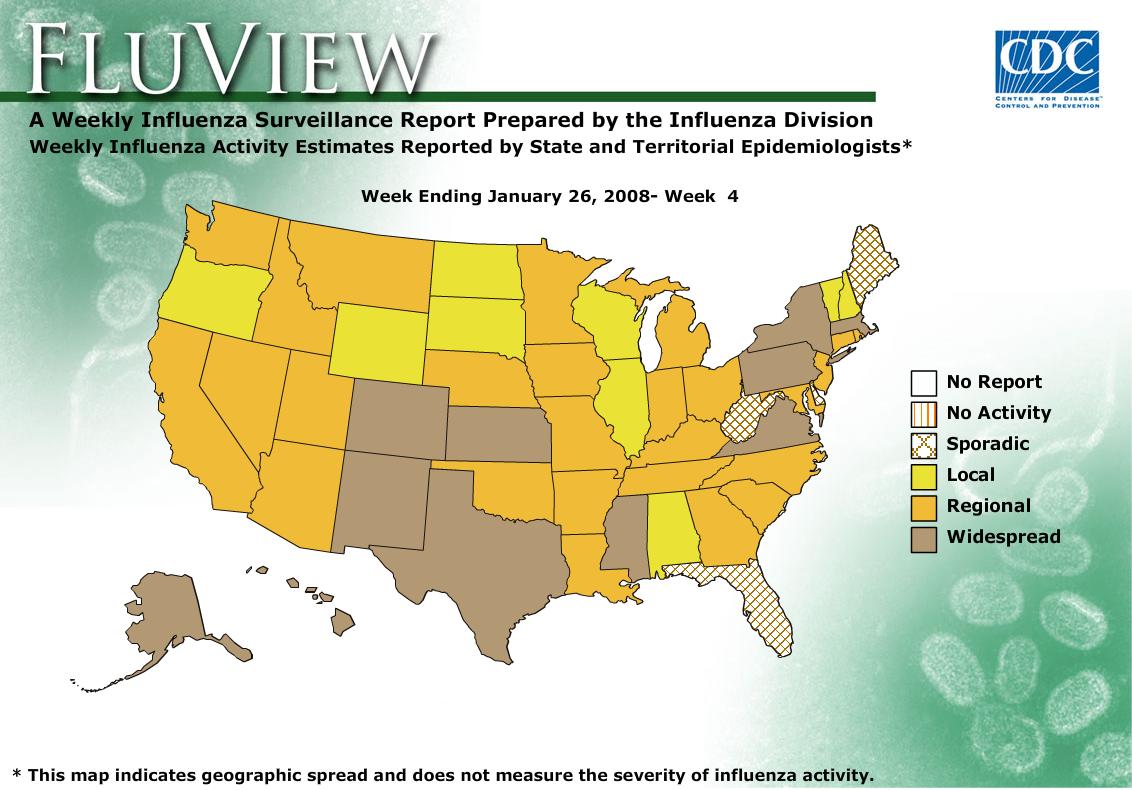
- Eleven states reported widespread influenza activity; 26 states reported regional influenza activity; nine states and the District of Columbia reported local influenza activity; and four states and Puerto Rico reported sporadic influenza activity.
Region |
Data for current week | Data cumulative for the season | |||||||
|---|---|---|---|---|---|---|---|---|---|
| Sentinel Provider ILI* | DoD and VA ARI* | % pos. for flu† | # jurisdictions reporting regional or widespread activity‡ | A (H1) | A (H3) | A Unsub-typed | B | Pediatric Deaths | |
| Nation | Elevated | Normal | 16.8 % | 37 of 51 | 654 | 347 | 2700 | 626 | 1 |
| New England | Elevated | Normal | 6.4 % | 3 of 6 | 19 | 1 | 86 | 53 | 0 |
| Mid-Atlantic | Normal | Normal | 8.1 % | 3 of 3 | 17 | 4 | 161 | 108 | 0 |
| East North Central | Elevated | Normal | 26.3 % | 3 of 5 | 60 | 91 | 16 | 61 | 0 |
| West North Central | Elevated | Normal | 12.2 % | 5 of 7 | 12 | 7 | 195 | 35 | 0 |
| South Atlantic | Elevated | Normal | 13.4 % | 5 of 9 | 56 | 71 | 454 | 127 | 0 |
| East South Central | Elevated | Normal | 12.0 % | 3 of 4 | 4 | 25 | 7 | 5 | 0 |
| West South Central | Elevated | Normal | 23.0 % | 4 of 4 | 33 | 97 | 1259 | 77 | 1 |
| Mountain | Elevated | Normal | 17.6 % | 7 of 8 | 242 | 35 | 284 | 109 | 0 |
| Pacific | Elevated | Normal | 14.6 % | 4 of 5 | 211 | 16 | 238 | 51 | 0 |
* Elevated means the % of visits for ILI or ARI is at or above the national or
region-specific baseline
?National data is for current week; regional data is for the most recent 3 weeks.
?Includes all 50 states and the District of Columbia
Laboratory Surveillance
During week 4, WHO and NREVSS laboratories reported 4,034 specimens tested for influenza viruses, 677 (16.8%) of which were positive, including 64 influenza A (H1) viruses, 69 influenza A (H3) viruses, 452 influenza A viruses that were not subtyped, and 92 influenza B viruses. The District of Columbia and 47 states from all nine surveillance regions have reported laboratory-confirmed influenza this season.
Since September 30, 2007, WHO and NREVSS laboratories have tested a total of 71,887 specimens for influenza viruses and 4,327 (6.0%) were positive. Among the 4,327 influenza viruses, 3,701 (85.5%) were influenza A viruses and 626 (14.5%) were influenza B viruses. One thousand one (27.0%) of the 3,701 influenza A viruses have been subtyped: 654 (65.3%) were influenza A (H1) viruses and 347 (34.7%) were influenza A (H3) viruses.
View WHO-NREVSS Regional Bar Charts | View Chart Data | View Full Screen
Antigenic Characterization:
CDC has antigenically characterized 197 influenza viruses [101 influenza A (H1), 53 influenza A (H3), and 43 influenza B viruses] collected by U.S. laboratories since September 30, 2007.
Influenza A (H1) [101]
- Ninety-seven (96%) of the 101 viruses were characterized as A/Solomon Islands/3/2006, the influenza A (H1) component of the 2007-08 influenza vaccine for the Northern Hemisphere and the 2008 influenza A (H1) component for the Southern Hemisphere.
- Four (4%) of the 101 viruses showed somewhat reduced titers with antisera produced against A/Solomon Islands/3/2006.
Influenza A (H3) [53]
- Six (11%) of the 53 viruses were characterized as A/Wisconsin/67/2005-like, the influenza A (H3) component of the 2007-08 influenza vaccine for the Northern Hemisphere.
- Forty-six (87%) of the 53 viruses were characterized as A/Brisbane/10/2007-like. A/Brisbane/10/2007 is a recent antigenic variant which evolved from A/Wisconsin/67/2005-like. A/Brisbane/10/2007-like virus is the recommended influenza A (H3) component for the 2008 Southern Hemisphere vaccine.
- One (2%) of the 53 viruses showed somewhat reduced titers with antisera produced against A/Wisconsin/67/2005 and A/Brisbane/10/2007.
Influenza B (B/Victoria/02/87 and B/Yamagata/16/88 lineages) [43]It is too early in the influenza season to determine which influenza viruses will predominate or how well the vaccine and circulating strains will match.
Victoria lineage [3]
- Three (7%) of the 43 influenza B viruses characterized belong to the B/Victoria lineage of viruses.
o Two (67%) of these 3 viruses were characterized as B/Ohio/01/2005-like. The recommended influenza B component for the 2007-08 influenza vaccine is a B/Malaysia/2506/2004-like virus, belonging to the B/Victoria lineage. B/Ohio/01/2005 is a recent B/Malaysia/2506/2004-like reference strain.
o One (33%) of these 3 viruses showed somewhat reduced titers with antisera produced against B/Ohio/01/2005 and B/Malaysia/2506/2004.Yamagata lineage [40]
- Forty (93%) of the 43 viruses were identified as belonging to the B/Yamagata lineage of viruses.
Pneumonia and Influenza (P&I) Mortality Surveillance
During week 4, 7.9% of all deaths reported through the 122-Cities Mortality Reporting System were reported as due to P&I. This percentage is above the epidemic threshold of 7.1% for week 4.
View Full Screen
Influenza-Associated Pediatric Mortality
No influenza-associated pediatric deaths were reported during week 4. One influenza-associated pediatric death occurring during the 2007-08 season has been reported.
View Full Screen
Influenza-Associated Pediatric Hospitalizations
Laboratory-confirmed influenza-associated pediatric hospitalizations are monitored in two population-based surveillance networks: the New Vaccine Surveillance Network (NVSN) and the Emerging Infections Program (EIP).
During November 4, 2007-January 12, 2008, the preliminary laboratory-confirmed influenza-associated hospitalization rate reported by the NVSN for children 0-4 years old was 0.73 per 10,000.
View Full Screen
During September 30 ?January 19, 2008, the preliminary laboratory-confirmed influenza-associated hospitalization rate reported by the EIP for children 0?7 years old was 0.25 per 10,000. For children aged 0-4 years and 5-17 years, the rate was 0.7 per 10,000 and 0.07 per 10,000, respectively.
View Full Screen
Outpatient Illness Surveillance
Nationwide during week 4, 4.0% of outpatient visits reported through the U.S. Influenza Sentinel Provider Surveillance Network were due to influenza-like illness (ILI), which is above the national baseline of 2.2%. On a regional level, the percentage of visits for ILI increased in all nine regions compared to last week and ranged from 1.9% to 7.8%. The East North Central, East South Central, Mountain, New England, Pacific, South Atlantic, West North Central, and West South Central regions reported ILI above their region-specific baselines.
During week 4, 2.9% of patient visits to Department of Veterans Affairs (VA) and Department of Defense (DoD) outpatient treatment facilities were for acute respiratory illness (ARI), which was below the national baseline of 3.2%. On a regional level, the percentage of visits for ARI ranged from 1.4% to 3.8%, and was below all nine region-specific baselines. The percentage of visits reported for ARI was slightly above the age-specific baseline in the 5-17 year age group.
View Sentinel Providers Regional Charts | View Chart Data |View Full Screen
View Full Screen
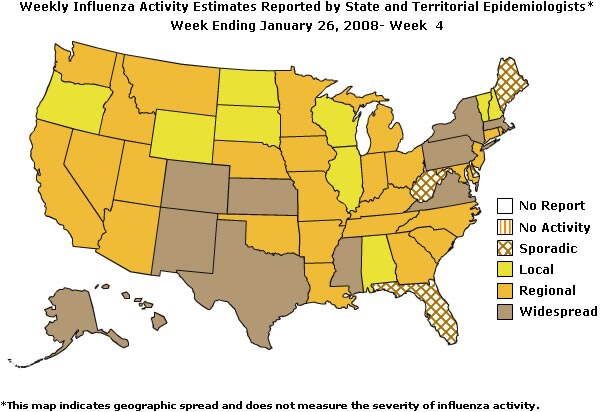
Geographic Spread of Influenza as Assessed by State and Territorial Epidemiologists
During week 4 the following influenza activity was reported:
- Widespread activity was reported by 11 states (Alaska, Colorado, Hawaii, Kansas, Massachusetts, Mississippi, New Mexico, New York, Pennsylvania, Texas, and Virginia).
- Regional activity was reported by 26 states (Arizona, Arkansas, California, Connecticut, Georgia, Idaho, Indiana, Iowa, Kentucky, Louisiana, Maryland, Michigan, Minnesota, Missouri, Montana, Nebraska, Nevada, New Jersey, North Carolina, Ohio, Oklahoma, Rhode Island, South Carolina, Tennessee, Utah, and Washington).
- Local activity was reported by the District of Columbia and nine states (Alabama, Illinois, New Hampshire, North Dakota, Oregon, South Dakota, Vermont, Wisconsin, and Wyoming).
- Sporadic activity was reported by Puerto Rico and four states (Delaware, Florida, Maine, and West Virginia).
--------------------------------------------------------------------------------
A description of surveillance methods is available at: http://www.cy118119.com/flu/weekly/fluactivity.htm
- Page last updated February 1, 2008. Error processing SSI file