Error processing SSI file
Error processing SSI file
Weekly Report: Influenza Summary Update
Week ending February 11, 2006-Week 6
Error processing SSI fileSynopsis:
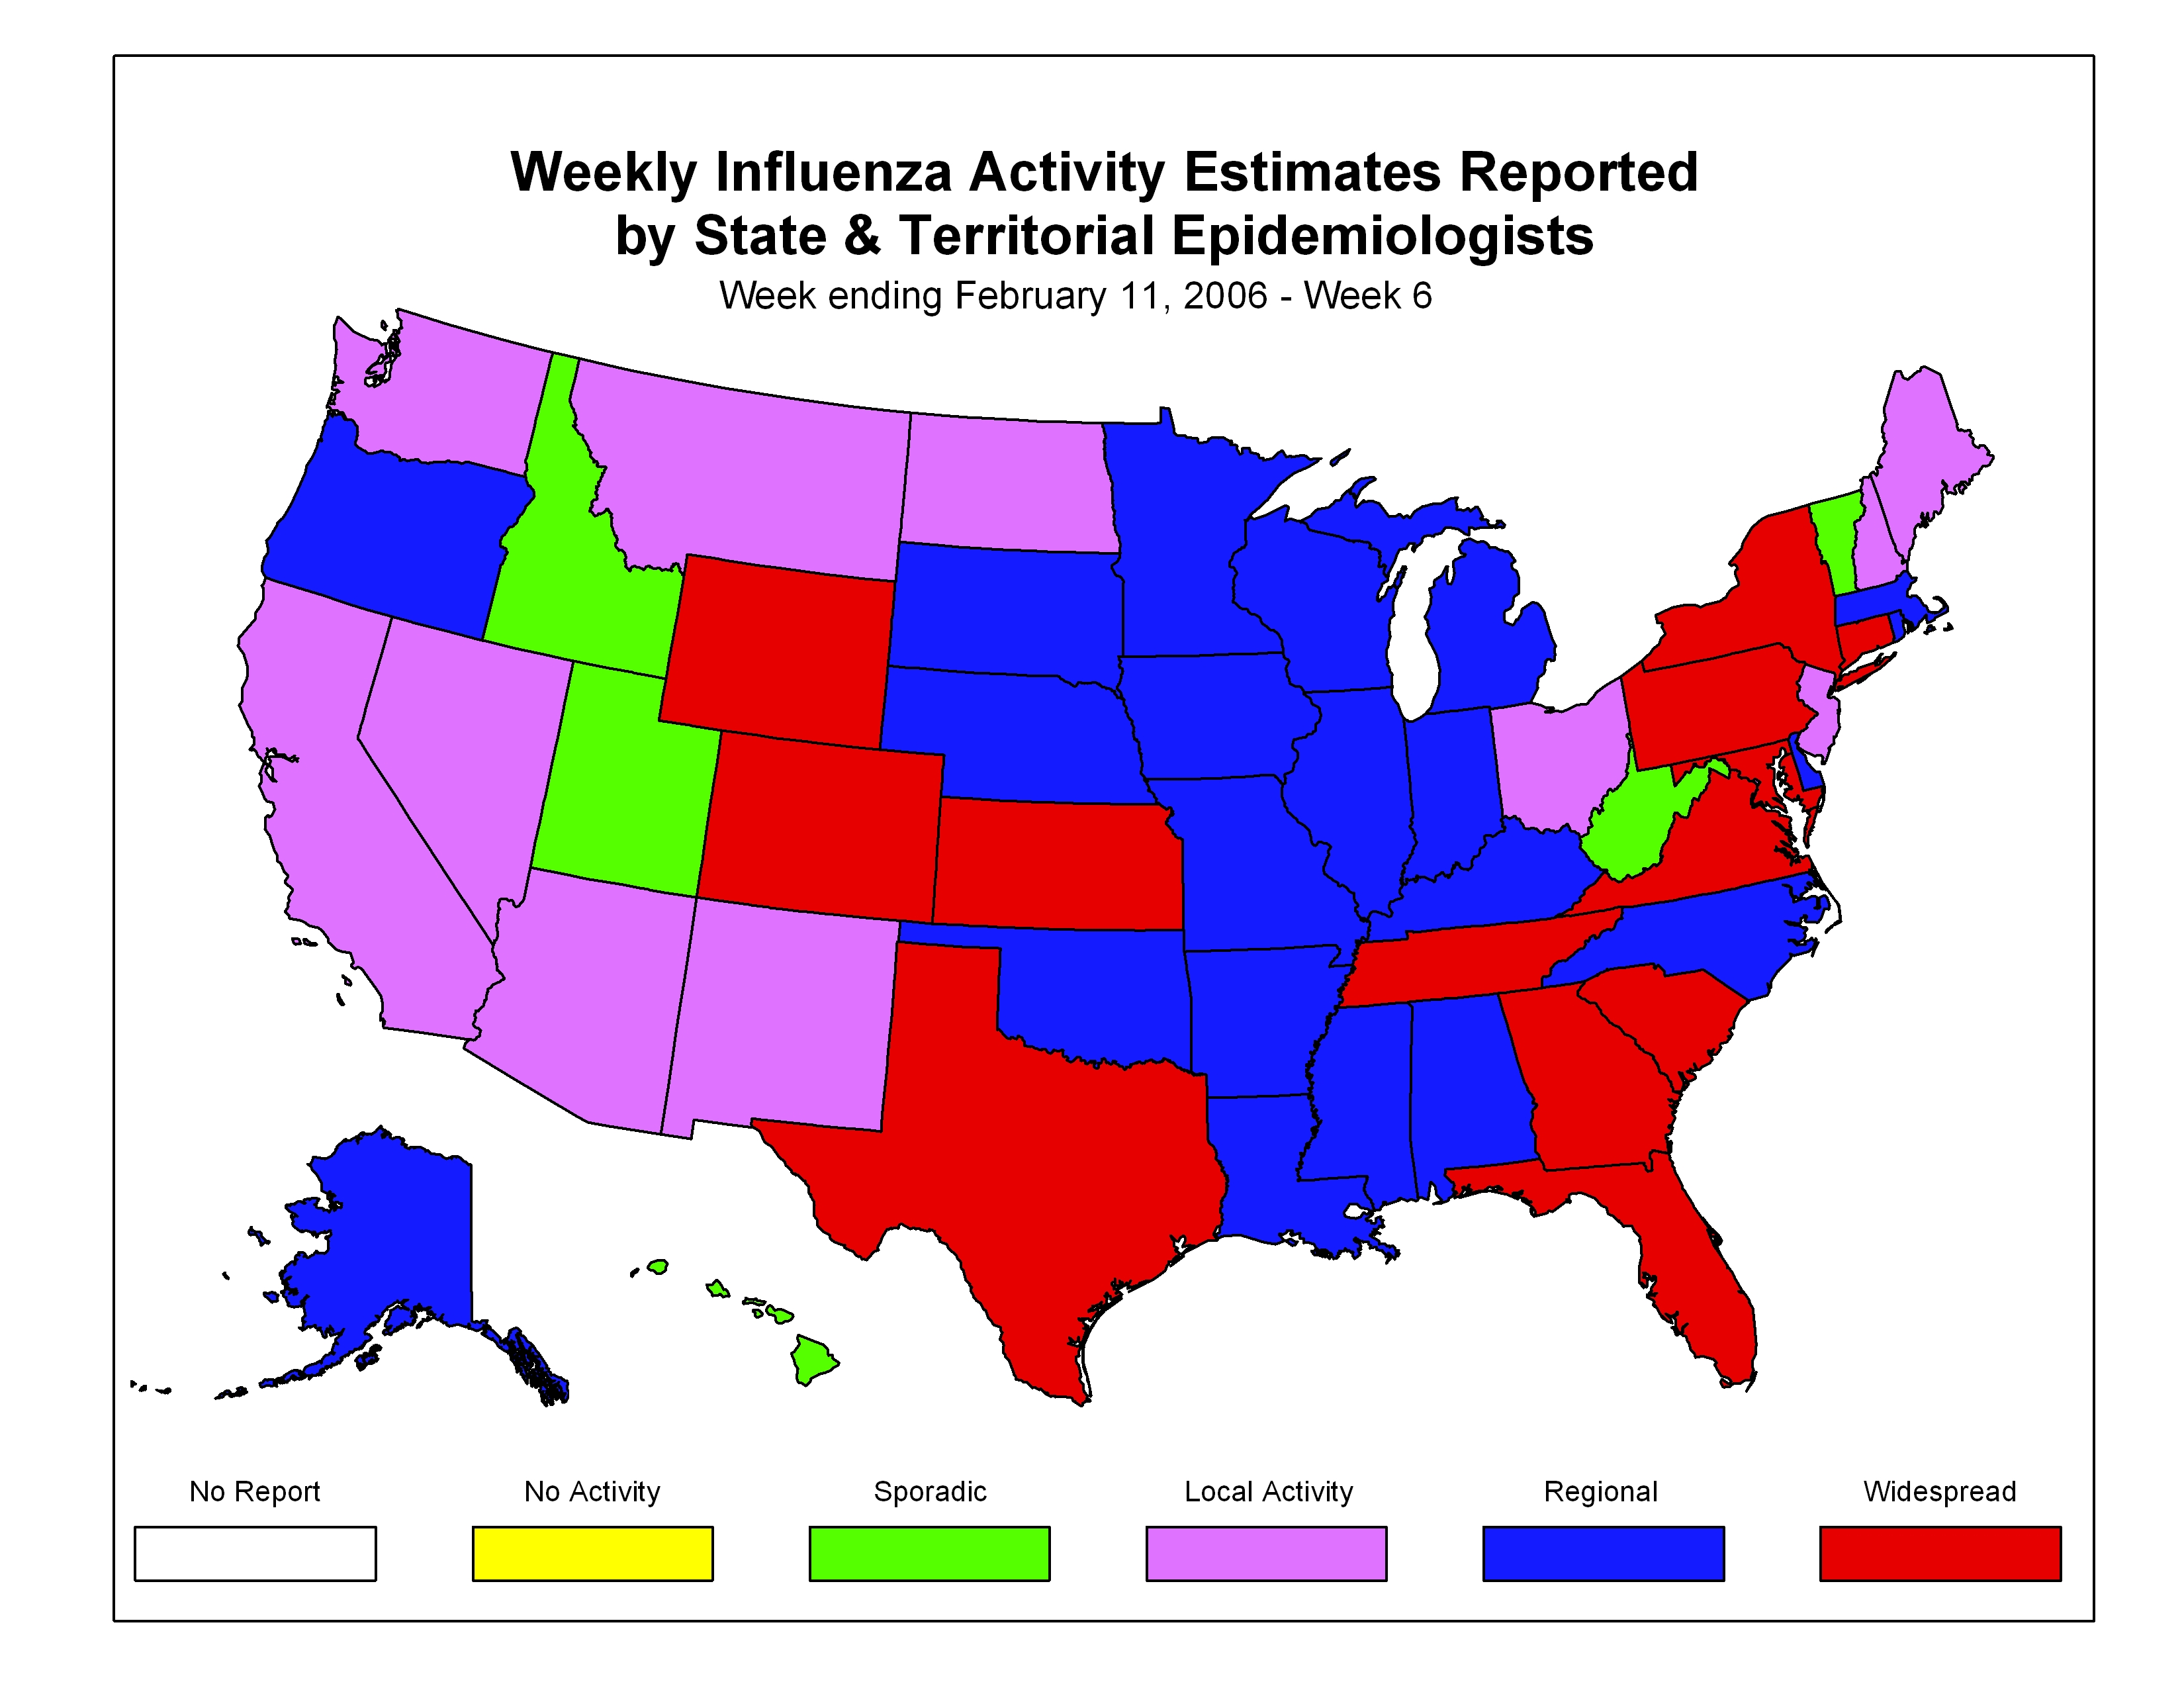
During week 6 (February 5 ?February 11, 2006)*, influenza activity increased in the United States, primarily in the eastern half of the country. Four hundred fifty-five specimens (18.7%) tested by U.S. World Health Organization (WHO) and National Respiratory and Enteric Virus Surveillance System (NREVSS) collaborating laboratories were positive for influenza. The proportion of patient visits to sentinel providers for influenza-like illness (ILI) was above the national baseline. The proportion of deaths attributed to pneumonia and influenza was below the baseline level. Thirteen states reported widespread influenza activity; 21 states and New York City reported regional influenza activity; 11 states and the District of Columbia reported local influenza activity; and 5 states and Puerto Rico reported sporadic influenza activity.
Laboratory Surveillance*:
During week 6, WHO and NREVSS laboratories reported 2,438 specimens tested for influenza viruses and 455 (18.7%) were positive. Of these, 136 were influenza A (H3N2) viruses, 6 were influenza A (H1N1) viruses, 280 were influenza A viruses that were not subtyped, and 33 were influenza B viruses.
Since October 2, 2005, WHO and NREVSS laboratories have tested a total of 66,129 specimens for influenza viruses and 5,216 (7.9%) were positive. Among the 5,216 influenza viruses, 5,025 (96.3%) were influenza A viruses and 191 (3.7%) were influenza B viruses. Two thousand three hundred seventy-eight (47.3%) of the 5,025 influenza A viruses have been subtyped: 2,351 (98.9%) were influenza A (H3N2) viruses and 27 (1.1%) were influenza A (H1N1) viruses. All states have reported laboratory-confirmed influenza this season. During the past 3 weeks (weeks 4 ?6), the largest number of isolates have been reported from the South Atlantic and Mountain regions**. During this time, the percentage of specimens testing positive for influenza has ranged from 26.3% and 23.4% in the East North Central and South Atlantic regions, respectively, to 7.4% in the Pacific region.

View WHO-NREVSS Regional
Bar Charts |
View Chart Data | View
Full Screen
Antigenic Characterization:
CDC has antigenically characterized 189 influenza viruses [149 influenza
A (H3N2), 9 influenza A (H1), and 31 influenza B viruses] collected by U.S.
laboratories since October 1, 2005. Of the 149 influenza A (H3N2) viruses,
123 were characterized as A/California/07/2004-like, which is the influenza
A (H3N2) component recommended for the 2005-06 influenza vaccine, and 26
showed reduced titers with antisera produced against A/California/07/2004.
The hemagglutinin proteins of 7 influenza A (H1) viruses were similar antigenically
to the hemagglutinin of the vaccine strain A/New Caledonia/20/99, and 2
showed reduced titers with antisera produced against A/New Caledonia/20/99.
Influenza B viruses currently circulating can be divided into two antigenically
distinct lineages represented by B/Yamagata/16/88 and B/Victoria/2/87 viruses.
Nineteen of the influenza B viruses characterized belong to the B/Yamagata
lineage. Two were similar to B/Shanghai/361/2002, the recommended influenza
B component for the 2005-06 influenza vaccine, and 17 were characterized
as B/Florida/07/2004-like. B/Florida/07/2004 is a minor antigenic variant
of B/Shanghai/361/2002. Twelve influenza B viruses were identified as belonging
to the B/Victoria lineage.
Pneumonia and Influenza (P&I) Mortality Surveillance*:
During week 6, 7.0% of all deaths reported by the vital statistics offices
of 122 U.S. cities were due to pneumonia or influenza. This percentage is
below the epidemic threshold of 8.3% for week 6.
Influenza-Associated Pediatric Mortality*:
No influenza-associated pediatric deaths were reported during week 6. Since October 2, 2005, CDC has received reports of 14 influenza-associated pediatric deaths, 12 of which occurred during the current influenza season.
Influenza-Associated Pediatric Hospitalizations*:
Laboratory-confirmed influenza-associated pediatric hospitalizations are monitored in two population-based surveillance networks?/sup>: the Emerging Infections Program (EIP) and the New Vaccine Surveillance Network (NVSN). During October 1, 2005 ?February 4, 2006, the preliminary influenza-associated hospitalization rate reported by the EIP for children aged 0-17 years was 0.30 per 10,000. For children aged 0-4 years and 5-17 years, the rate was 0.78 per 10,000 and 0.04 per 10,000, respectively. During October 30, 2005 ?February 4, 2006, the preliminary laboratory-confirmed influenza-associated hospitalization rate for children aged 0-4 years in the NVSN was 0.33 per 10,000. EIP and NVSN hospitalization rate estimates are preliminary and may change as data continue to be collected.
View
Full Screen
View
Full Screen
Influenza-like Illness Surveillance*:
During week 6, 2.5%*** of patient visits to U.S. sentinel providers were due to ILI. This percentage is above the national baseline of 2.2%. The percentage of visits for ILI ranged from 1.5% in the Pacific region to 4.7% in the West South Central region**. Due to wide variability in regional level data, it is not appropriate to apply the national baseline to regional level data.
View Sentinel Providers
Regional Charts | View
Chart Data | View
Full Screen
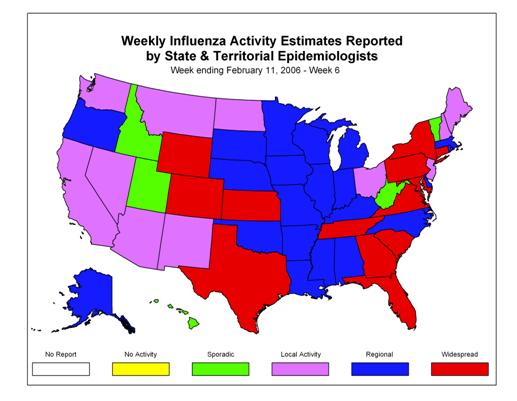
Influenza Activity as Assessed by State and Territorial Epidemiologists*:
During week 6, 13 states (Colorado, Connecticut, Florida, Georgia, Kansas, Maryland, New York, Pennsylvania, South Carolina, Tennessee, Texas, Virginia, and Wyoming) reported widespread influenza activity. Twenty-one states (Alabama, Alaska, Arkansas, Delaware, Illinois, Indiana, Iowa, Kentucky, Louisiana, Massachusetts, Michigan, Minnesota, Mississippi, Missouri, Nebraska, North Carolina, Oklahoma, Oregon, Rhode Island, South Dakota, and Wisconsin) and New York City reported regional influenza activity. Eleven states (Arizona, California, Maine, Montana, Nevada, New Hampshire, New Jersey, New Mexico, North Dakota, Ohio, and Washington) and the District of Columbia reported local influenza activity. Five states (Hawaii, Idaho, Utah, Vermont, and West Virginia) and Puerto Rico reported sporadic influenza activity.
--------------------------------------------------------------------------------
Report prepared February 17, 2006
Error processing SSI file