Asthma Severity among Adults with Current Asthma
Asthma severity determines type and duration of treatment
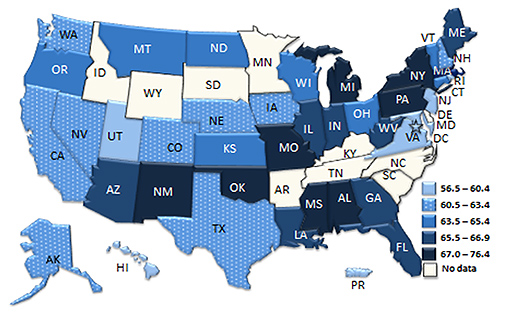
Percentage with Persistent Severity
Asthma severity* is the inherent intensity of the disease process. Disease progression and symptoms vary among individuals and within an individual’s experience over time. The population-based asthma severity prevalence estimate depends on whether the individual is treated or not and how well the individual responds to the treatment. Intermittent severity includes people who are well-controlled without long-term control medication. Persistent severity includes people who are on long-term control medications and people with uncontrolled asthma (not well-controlled or very poorly controlled) who are not on long-term control medication. Nearly 65% of adults with current asthma† have persistent asthma; 35% have intermittent asthma.
Intermittent and persistent asthma prevalence among adults varied by state during the years 2006-2010, but did not follow a specific geographic pattern. Intermittent asthma prevalence ranged from 23.6% in Alabama to 43.5% in Utah (See Table). Persistent asthma prevalence ranged from 56.5% in Utah to 76.4% in Alabama (See map for details).
*National Asthma Education and Prevention Program Expert panel report 3: Guidelines for the Diagnosis and Management of Asthma, 2007. Available at: http://www.nhlbi.nih.gov/guidelines/asthma/asthgdln.pdf Cdc-pdf[PDF – 3.88 MB]External. †Includes persons who answered “yes” to the questions: “Have you ever been told by a doctor, nurse, or other health professional that you had asthma?” and “Do you still have asthma?”
Source: Behavioral Risk Factors Surveillance System (BRFSS)—Adult Asthma Call-back survey Data, 2006-2010
Download this AsthmaStats Factsheet Cdc-pdf[PDF – 180 KB] containing additional information.
| Asthma Severity among Adults with Current Asthma | ||
|---|---|---|
| STATE | Intermittent Severity% | Persistent Severity% |
| U.S. Total** | 35.2 | 64.8 |
| AL | 23.6 | 76.4 |
| AK | 38.3 | 61.7 |
| AZ | 34.3 | 65.7 |
| CA | 36.6 | 63.4 |
| CO | 39.7 | 60.3 |
| CT | 34.8 | 65.2 |
| DC | 42.4 | 57.6 |
| FL | 33.3 | 66.7 |
| GA | 34.3 | 65.7 |
| HI | 43.1 | 56.9 |
| IL | 33.9 | 66.1 |
| IN | 39.2 | 66.8 |
| IA | 38.9 | 61.1 |
| KS | 36.2 | 63.8 |
| LA | 33.8 | 66.2 |
| ME | 34.0 | 66.0 |
| MD | 40.2 | 59.8 |
| MA | 32.3 | 67.7 |
| MI | 32.6 | 67.4 |
| MS | 32.0 | 69.0 |
| MO | 30.7 | 69.3 |
| MT | 35.3 | 64.7 |
| NE | 38.3 | 61.7 |
| NV | 37.0 | 63.0 |
| NH | 38.4 | 61.6 |
| NJ | 42.2 | 57.8 |
| NM | 31.3 | 68.7 |
| NY | 32.0 | 68.0 |
| ND | 34.7 | 65.3 |
| OH | 36.2 | 63.8 |
| OK | 31.7 | 68.3 |
| OR | 34.6 | 65.4 |
| PA | 32.6 | 67.4 |
| RI | 40.3 | 59.7 |
| TX | 36.8 | 63.2 |
| UT | 43.5 | 56.5 |
| VT | 35.3 | 64.7 |
| VA | 41.8 | 58.2 |
| WA | 39.5 | 60.4 |
| WV | 34.0 | 66.0 |
| WI | 34.8 | 65.2 |
| U.S. Territory | ||
| PR | 42.5 | 57.5 |
** U.S. Total includes participating states (n=40) plus District of Columbia and excludes the three U.S. territories