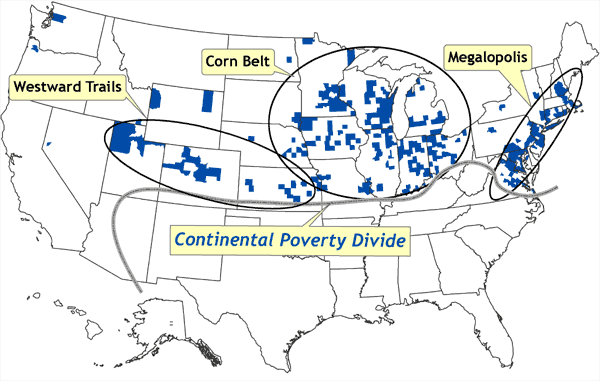
Figure 7. Location of counties that represent spatial clusters in which poverty rates are at least one standard deviation lower than the national mean. These areas of very low poverty correspond to the northeastern megalopolis of urban centers stretching from Richmond, Virginia, to metropolitan Boston; the Corn Belt of the Great Lakes states and the upper Midwest; and a region referred to here as Westward Trails, corresponding to a line of urban centers stretching from Kansas and Nebraska through Colorado to Utah. The continental poverty divide is defined as the distinctive north–south divide across most of the United States, in which concentrations of low poverty and spatial outliers of high poverty are confined to the northern half, and concentrations of high poverty and spatial outliers of low poverty are confined to the southern half. Data source: Community Health Status Indicators (1).
![]()
Volume 4: No. 4, October 2007