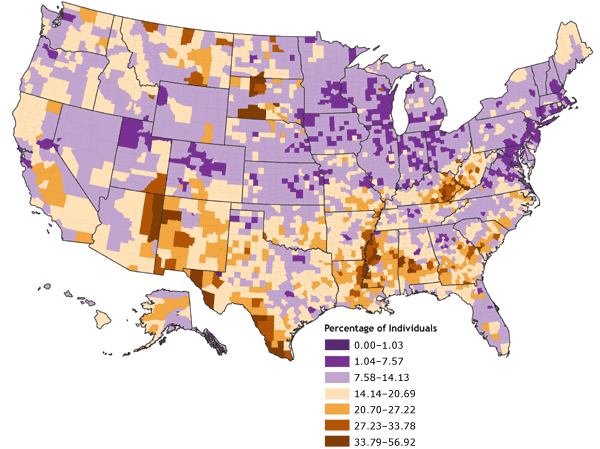
Figure 4. Percentage of individuals living in poverty, by county, 2000. Data are classified by standard deviations from the national mean. Source: Community Health Status Indicators (1).
Map of the United States showing the percentage of individuals living in poverty, by county. Overall, the map gives the impression that the percentage of individuals living in poverty (by county) is in the lower ranges in the northern half of the nation and in the higher ranges in the southern half.
| ?/th> | Range, Percentage | ||||||
|---|---|---|---|---|---|---|---|
| 0.00-1.03 | 1.04-7.57 | 7.58-14.13 | 14.14-20.69 | 20.70- 27.22 | 27.23-33.78 | 33.79-56.92 | |
| Number of counties in range | 1 | 372 | 1441 | 881 | 312 | 91 | 41 |
![]()
Volume 4: No. 4, October 2007