Error processing SSI file

2011-2012 Influenza Season Week 15 ending April 14, 2012
All data are preliminary and may change as more reports are received.
Synopsis:
During week 15 (April 8-14, 2012), influenza activity was elevated in some areas of the United States, but declined nationally and in most regions.
- U.S. Virologic Surveillance: Of the 3,730 specimens tested by U.S. World Health Organization (WHO) and National Respiratory and Enteric Virus Surveillance System (NREVSS) collaborating laboratories and reported to CDC/Influenza Division, 653 (17.5%) were positive for influenza.
- Pneumonia and Influenza (P&I) Mortality Surveillance: The proportion of deaths attributed to P&I was below the epidemic threshold.
- Influenza-associated Pediatric Mortality: Two influenza-associated pediatric deaths were reported. One was associated with a 2009 H1N1 virus and one was associated with a seasonal influenza A (H3) virus.
- Outpatient Illness Surveillance: The proportion of outpatient visits for influenza-like illness (ILI) was 1.5%, which is below the national baseline of 2.4%. Region 10 reported ILI above its region-specific baseline level. Two states experienced low ILI activity; New York City and 48 states experienced minimal ILI activity, and the District of Columbia had insufficient data to calculate ILI activity.
- Geographic Spread of Influenza: Six states reported widespread geographic activity; 9 states reported regional influenza activity; 17 states reported local activity; the District of Columbia and 18 states reported sporadic activity; Guam and the U.S. Virgin Islands reported no influenza activity, and Puerto Rico did not report.
| HHS Surveillance Regions* | Data for current week | Data cumulative since October 2, 2011 (Week 40) | ||||||||
|---|---|---|---|---|---|---|---|---|---|---|
| Out-patient ILI† | % of respiratory specimens positive for flu‡ | Number of jurisdictions reporting regional or widespread activity§ | A (H3) | 2009 H1N1 | A(Subtyping not performed) | B | Pediatric Deaths | |||
| Nation | Normal | 17.5% | 15 of 54 | 8,749 | 3,473 | 3,709 | 1,632 | 15 | ||
| Region 1 | Normal | 23.1% | 4 of 6 | 239 | 81 | 63 | 68 | 0 | ||
| Region 2 | Normal | 16.1% | 2 of 4 | 195 | 168 | 119 | 100 | 0 | ||
| Region 3 | Normal | 17.4% | 0 of 6 | 659 | 133 | 152 | 169 | 0 | ||
| Region 4 | Normal | 12.7% | 1 of 8 | 523 | 186 | 1,132 | 257 | 3 | ||
| Region 5 | Normal | 40.6% | 0 of 6 | 2,453 | 188 | 110 | 211 | 1 | ||
| Region 6 | Normal | 12.3% | 0 of 5 | 251 | 434 | 799 | 163 | 4 | ||
| Region 7 | Normal | 12.0% | 0 of 4 | 1,290 | 154 | 296 | 43 | 1 | ||
| Region 8 | Normal | 24.8% | 2 of 6 | 1,361 | 1,041 | 643 | 71 | 0 | ||
| Region 9 | Normal | 27.3% | 3 of 5 | 1,137 | 766 | 365 | 184 | 6 | ||
| Region 10 | Elevated | 38.9% | 3 of 4 | 641 | 322 | 30 | 366 | 0 | ||
*HHS regions (Region 1 CT, ME, MA, NH, RI, VT; Region 2: NJ, NY, Puerto Rico, US Virgin Islands; Region 3: DE, DC, MD, PA, VA, WV; Region 4: AL, FL, GA, KY, MS, NC, SC, TN; Region 5: IL, IN, MI, MN, OH, WI; Region 6: AR, LA, NM, OK, TX; Region 7: IA, KS, MO, NE; Region 8: CO, MT, ND, SD, UT, WY; Region 9: AZ, CA, Guam, HI, NV; and Region 10: AK, ID, OR, WA).
† Elevated means the % of visits for ILI is at or above the national or region-specific baseline
‡ National data are for current week; regional data are for the most recent three weeks
§ Includes all 50 states, the District of Columbia, Guam, Puerto Rico, and U.S. Virgin Islands
U.S. Virologic Surveillance:
WHO and NREVSS collaborating laboratories located in all 50 states report to CDC the number of respiratory specimens tested for influenza and the number positive by influenza type and subtype. The results of tests performed during the current week are summarized in the table below.
| Week 15 | |
|---|---|
| No. of specimens tested | 3,730 |
| No. of positive specimens (%) | 653 (17.5%) |
| Positive specimens by type/subtype | |
| Influenza A | 533 (81.6%) |
| 2009 H1N1 | 106 (19.9%) |
| Subtyping not performed | 138 (25.9%) |
| (H3) | 289 (54.2%) |
| Influenza B | 120 (18.4%) |
Predominant influenza viruses can vary by region and even between states within the same region. Seasonal influenza A (H3) viruses have predominated since the start of the 2011-2012 season nationally and in most regions, however, 2009 H1N1 and influenza B viruses continue to circulate. The timing of influenza activity also can vary by region. While influenza activity may have peaked and be declining in some states or regions, other areas may not yet have reached their peak activity level. Influenza viruses circulate year-round and substantial activity may occur as late as May.
View National and Regional Level Graphs and Data | View Chart Data | View Full Screen | View PowerPoint Presentation
Antigenic Characterization:
CDC has antigenically characterized 1,219 influenza viruses [321 2009 H1N1 viruses, 745 influenza A (H3N2) viruses, and 153 influenza B viruses] collected by U.S. laboratories since October 1, 2011.
2009 H1N1 [321]
- Three hundred fifteen (98.1%) of the 321 viruses were characterized as A/California/7/2009-like, the influenza A (H1N1) component of the 2011-2012 influenza vaccine for the Northern Hemisphere.
- Six viruses (1.9%) tested showed reduced titers with antiserum produced against A/California/7/2009.
Influenza A (H3N2) [745]
- Six hundred six (81.3%) of the 745 viruses were characterized as A/Perth/16/2009-like, the influenza A (H3N2) component of the 2011-2012 influenza vaccine for the Northern Hemisphere.
- One hundred thirty-nine viruses (18.7%) tested showed reduced titers with antiserum produced against A/Perth/16/2009.
Influenza B (B/Victoria/02/87 and B/Yamagata/16/88 lineages) [153]:
- Victoria Lineage [64]: Sixty-four (42.1%) of the 152 influenza B viruses tested belong to the B/Victoria lineage of viruses.
- Fifty-eight (90.6%) of these 64 viruses were characterized as B/Brisbane/60/2008-like, the influenza B component of the 2011-2012 Northern Hemisphere influenza vaccine.
- Six (9.4%) of these 64 viruses showed reduced titers with antisera produced against B/Brisbane/60/2008.
- Yamagata Lineage [89]: Eighty-nine (58.2%) of the 153 influenza B viruses tested belong to the B/Yamagata lineage of viruses.
Only a small number of influenza B viruses from the United States have been available for testing this season. While less than 50% of these viruses are similar to the influenza B component in the 2011-2012 influenza vaccine, the majority of influenza B viruses circulating worldwide have been similar to the influenza B component of the 2011-2012 Northern Hemisphere influenza vaccine.
Composition of the 2012-2013 Influenza Vaccine:
The World Health Organization (WHO) has recommended vaccine viruses for the 2012-2013 Northern Hemisphere influenza vaccines, and FDA’s Vaccines and Related Biological Products Advisory Committee (VRBPAC) has made recommendations for the composition of the 2012-2013 U.S. influenza vaccines. Both agencies recommend that the vaccine contain A/California/7/2009-like (2009 H1N1), A/Victoria/361/2011-like (H3N2), and B/Wisconsin/1/2010-like (B/Yamagata lineage) viruses. This recommendation changes the influenza A (H3N2) and influenza B virus components of the 2011-2012 Northern Hemisphere vaccine formulation. This recommendation was based on global influenza virus surveillance data related to epidemiology and antigenic characteristics, serological responses to 2011-2012 trivalent seasonal vaccines, and the availability of candidate strains and reagents.
Antiviral Resistance:
Testing of 2009 influenza A (H1N1), influenza A (H3N2), and influenza B virus isolates for resistance to neuraminidase inhibitors (oseltamivir and zanamivir) is performed at CDC using a functional assay. Additional 2009 influenza A (H1N1) clinical samples are tested for a single mutation in the neuraminidase of the virus known to confer oseltamivir resistance (H275Y). The data summarized below combine the results of both testing methods. These samples are routinely obtained for surveillance purposes rather than for diagnostic testing of patients suspected to be infected with an antiviral resistant virus.
High levels of resistance to the adamantanes (amantadine and rimantadine) persist among 2009 H1N1 and A (H3N2) viruses (the adamantanes do not have activity against influenza B viruses). As a result of the sustained high levels of resistance among circulating influenza A viruses, data from adamantane resistance testing are not presented in the table below.
| Oseltamivir | Zanamivir | |||
|---|---|---|---|---|
| Virus Samples tested (n)* | Resistant Viruses, Number (%) | Virus Samples tested (n) | Resistant Viruses, Number (%) | |
| Influenza A (H3N2) | 780 | 0 (0.0) | 780 | 0 (0.0) |
| Influenza B | 200 | 0 (0.0) | 200 | 0 (0.0) |
| 2009 H1N1 | 609 | 13 (2.1) | 342 | 0 (0.0) |
*Includes specimens tested in national surveillance and additional specimens tested at public health laboratories in eight states (DE, FL, MD, MI, MN, NY, TX, and WA) who share testing results with CDC.
Rare sporadic cases of oseltamivir resistant 2009 H1N1 and influenza A (H3N2) viruses have been detected worldwide. Antiviral treatment with oseltamivir or zanamivir is recommended as early as possible for patients with confirmed or suspected influenza who have severe, complicated, or progressive illness; who require hospitalization; or who are at greater risk for influenza-related complications. Additional information on recommendations for treatment and chemoprophylaxis of influenza virus infection with antiviral agents is available at (http://www.cy118119.com/flu/antivirals/index.htm).
Pneumonia and Influenza (P&I) Mortality Surveillance:
During week 15, 7.0% of all deaths reported through the 122-Cities Mortality Reporting System were due to P&I. This percentage was below the epidemic threshold of 7.7% for week 15.
View Full Screen | View PowerPoint Presentation
Influenza-Associated Pediatric Mortality:
Two influenza-associated pediatric deaths were reported to CDC during week 15. One was associated with a 2009 H1N1 virus and one was associated with a seasonal influenza A (H3) virus. The deaths reported during week 15 occurred during the week ending March 31, 2012 (week 13). This brings the total number of influenza-associated pediatric deaths reported during the 2011-2012 season to 15.
View Full Screen | View PowerPoint Presentation
Influenza-Associated Hospitalizations:
The Influenza Surveillance Network (FluSurv-NET) conducts population-based surveillance for laboratory-confirmed influenza-associated hospitalizations in children younger than 18 years of age (since the 2003-2004 influenza season) and adults (since the 2005-2006 influenza season).
The FluSurv-NET covers more than 80 counties in the 10 Emerging Infections Program (EIP) states (CA, CO, CT, GA, MD, MN, NM, NY, OR, TN) and additional Influenza Hospitalization Surveillance Project (IHSP) states. The IHSP began during the 2009-2010 season to enhance surveillance during the 2009 H1N1 pandemic. IHSP sites included IA, ID, MI, OK and SD during the 2009-2010 season; ID, MI, OH, OK, RI, and UT during the 2010-2011 season; and MI, OH, RI, and UT during the 2011-2012 season. The rates provided are likely to be a vast underestimate of the actual number of influenza-associated hospitalizations. First, the FluSurv-NET is not nationally representative, and second, influenza-associated hospitalizations can be missed, either because testing is not performed, or because cases may be attributed to other causes of pneumonia or other common influenza-related complications.
Between October 1, 2011 and April 14, 2012, 1,926 laboratory-confirmed influenza-associated hospitalizations were reported at a rate of 7.0 per 100,000 population. Among cases, 1,692 (87.9%) were influenza A, 215 (11.2%) were influenza B, and 4 (0.2%) were influenza A and B co-infections; 15 (0.8%) had no virus type information. Among those with influenza A subtype information, 664 (73.3%) were H3N2 and 238 (26.3%) were 2009 H1N1. The most commonly reported underlying medical conditions among adults were chronic lung diseases, obesity and metabolic disorders. The most commonly reported underlying medical conditions in children were chronic lung diseases, asthma and neurologic disorders. However, half of hospitalized children had no identified underlying medical conditions.
View Full Screen | View PowerPoint Presentation
Outpatient Illness Surveillance:
Nationwide during week 15, 1.5% of patient visits reported through the U.S. Outpatient Influenza-like Illness Surveillance Network (ILINet) were due to influenza-like illness (ILI). This percentage is below the national baseline of 2.4%. (ILI is defined as fever (temperature of 100°F [37.8°C] or greater) and cough and/or sore throat.)
View National and Regional Level Graphs and Data | View Chart Data | View Full Screen | View PowerPoint Presentation
On a regional level, the percentage of outpatient visits for ILI ranged from 0.6% to 2.4% during week 15. Region 10 reported a proportion of outpatient visits for ILI above its region-specific baseline level.
ILINet State Activity Indicator Map:
Data collected in ILINet are used to produce a measure of ILI activity* by state. Activity levels are based on the percent of outpatient visits in a state due to ILI and are compared to the average percent of ILI visits that occur during spring and fall weeks with little or no influenza virus circulation. Activity levels range from minimal, which corresponds to ILI activity being below average, to intense, which corresponds to ILI activity being much higher than average. Because the clinical definition of ILI is very general, not all ILI is caused by influenza; however, when combined with laboratory data, the information on ILI activity provides a clearer picture of influenza activity in the United States.
During week 15, the following ILI activity levels were experienced:
- Two states experienced low ILI activity (Alaska and Oregon).
- New York City and 48 states experienced minimal ILI activity (Alabama, Arizona, Arkansas, California, Colorado, Connecticut, Delaware, Florida, Georgia, Hawaii, Idaho, Illinois, Indiana, Iowa, Kansas, Kentucky, Louisiana, Maine, Maryland, Massachusetts, Michigan, Minnesota, Mississippi, Missouri, Montana, Nebraska, Nevada, New Hampshire, New Jersey, New Mexico, New York, North Carolina, North Dakota, Ohio, Oklahoma, Pennsylvania, Rhode Island, South Carolina, South Dakota, Tennessee, Texas, Utah, Vermont, Virginia, Washington, West Virginia, Wisconsin, and Wyoming).
- Data were insufficient to calculate an ILI activity level from the District of Columbia.
*This map uses the proportion of outpatient visits to health care providers for influenza-like illness to measure the ILI activity level within a state. It does not, however, measure the extent of geographic spread of flu within a state. Therefore, outbreaks occurring in a single city could cause the state to display high activity levels.
Data collected in ILINet may disproportionately represent certain populations within a state, and therefore, may not accurately depict the full picture of influenza activity for the whole state.
Data displayed in this map are based on data collected in ILINet, whereas the State and Territorial flu activity map are based on reports from state and territorial epidemiologists. The data presented in this map is preliminary and may change as more data is received.
Differences in the data presented here by CDC and independently by some state health departments likely represent differing levels of data completeness with data presented by the state likely being the more complete.
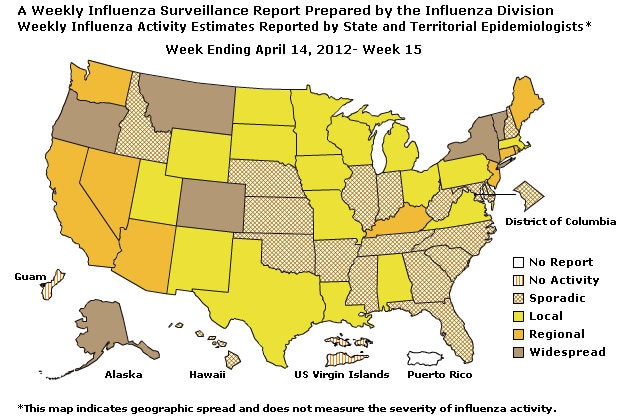
Geographic Spread of Influenza as Assessed by State and Territorial Epidemiologists:
The influenza activity reported by state and territorial epidemiologists indicates geographic spread of influenza viruses, but does not measure the intensity of influenza activity.
During week 15, the following influenza activity was reported:
- Widespread influenza activity was reported by 6 states (Alaska, Colorado, Montana, New York, Oregon, and Vermont).
- Regional influenza activity was reported by 9 states (Arizona, California, Connecticut, Kentucky, Maine, Nevada, New Jersey, Rhode Island, and Washington).
- Local influenza activity was reported by 17 states (Alabama, Iowa, Louisiana, Massachusetts, Michigan, Minnesota, Missouri, New Mexico, North Dakota, Ohio, Pennsylvania, South Dakota, Texas, Utah, Virginia, Wisconsin, and Wyoming).
- Sporadic influenza activity was reported by the District of Columbia and 18 states (Arkansas, Delaware, Florida, Georgia, Hawaii, Illinois, Idaho, Indiana, Kansas, Maryland, Mississippi, Nebraska, New Hampshire, North Carolina, Oklahoma, South Carolina, Tennessee, and West Virginia).
- Guam and the U. S. Virgin Islands reported no influenza activity.
- Puerto Rico did not report.
- Content Source: Coordinating Center for Infectious Diseases (CCID)
- National Center for Immunization and Respiratory Diseases (NCIRD)
Flu Activity data in XML Format | View Full Screen
Additional National and International Influenza Surveillance Information
U.S. State and local influenza surveillance: Click on a jurisdiction below to access the latest local influenza information.
Google Flu Trends: Google Flu Trends uses aggregated Google search data in a model created in collaboration with CDC to estimate influenza activity in the United States. For more information and activity estimates from the U.S. and worldwide, see http://www.google.org/flutrends/
Europe: for the most recent influenza surveillance information from Europe, please see WHO/Europe at http://www.euroflu.org/index.php and visit the European Centre for Disease Prevention and Control at http://ecdc.europa.eu/en/publications/surveillance_reports/influenza/Pages/weekly_influenza_surveillance_overview.aspx
Public Health Agency of Canada: The most up-to-date influenza information from Canada is available at http://www.phac-aspc.gc.ca/fluwatch/
World Health Organization FluNet: Additional influenza surveillance information from participating WHO member nations is available at FluNet and the Global Epidemiology Reports
--------------------------------------------------------------------------------
A description of surveillance methods is available at: http://www.cy118119.com/flu/weekly/overview.htm
