Error processing SSI file

2010-2011 Influenza Season Week 40 ending October 9, 2010
All data are preliminary and may change as more reports are received.
Background:
The Centers for Disease Control and Prevention’s (CDC) Influenza Division collects and analyzes surveillance data year-round and produces a weekly report on U.S. influenza activity from October through May. The U.S. influenza surveillance system consists of information in five different categories collected from nine different data sources.
- Viral Surveillance: U.S. World Health Organization (WHO) collaborating laboratories, the National Respiratory and Enteric Virus Surveillance System (NREVSS), and human infection with novel influenza A virus case reporting;
- Outpatient Illness Surveillance: U.S. Outpatient Influenza-like Illness Surveillance Network;
- Mortality: 122-Cities Mortality Reporting System and influenza-associated pediatric mortality;
- Hospitalizations: Influenza hospitalization network (FluSurv-NET) including the Emerging Infections Program (EIP); and aggregate hospitalization and death reporting activity (AHDRA),
- Summary of geographic spread of influenza: state and territorial epidemiologists’ reports.
Synopsis:
Influenza A (H3N2), 2009 influenza A (H1N1), and influenza B viruses co-circulated at low levels in the United States during the summer months. During week 40 (October 3-9, 2010), influenza activity was low in the U.S.
- Forty-five (3.3%) specimens tested by U.S. World Health Organization (WHO) and National Respiratory and Enteric Virus Surveillance System (NREVSS) collaborating laboratories and reported to CDC/Influenza Division were positive for influenza.
- The proportion of deaths attributed to pneumonia and influenza (P&I) was below the epidemic threshold.
- No influenza-associated pediatric deaths were reported.
- The proportion of outpatient visits for influenza-like illness (ILI) was below the national baseline. All 10 regions reported ILI below region-specific baseline levels and all 48 states with sufficient data experienced minimal ILI activity.
- Geographic spread of influenza in the District of Columbia, Guam, Puerto Rico, and 19 states was assessed as sporadic, 31 states reported no influenza activity and the U.S. Virgin Islands did not report.
| HHS Surveillance Regions* | Data for current week | Data cumulative since October 3, 2010 (Week 40) | ||||||||
|---|---|---|---|---|---|---|---|---|---|---|
| Out-patient ILI† | % positive for flu‡ | Number of jurisdictions reporting regional or widespread activity§ | A (H3) | 2009 A (H1N1) | A(Subtyping not performed) | B | Pediatric Deaths | |||
| Nation | Normal | 3.3% | 0 of 54 | 5 | 4 | 22 | 14 | 0 | ||
| Region 1 | Normal | 0.0% | 0 of 6 | 0 | 0 | 0 | 0 | 0 | ||
| Region 2 | Normal | 0.7% | 0 of 4 | 0 | 0 | 0 | 0 | 0 | ||
| Region 3 | Normal | 0.8% | 0 of 6 | 2 | 0 | 0 | 1 | 0 | ||
| Region 4 | Normal | 5.5% | 0 of 8 | 0 | 0 | 16 | 12 | 0 | ||
| Region 5 | Normal | 2.2% | 0 of 6 | 1 | 0 | 0 | 0 | 0 | ||
| Region 6 | Normal | 0.8% | 0 of 5 | 0 | 0 | 3 | 0 | 0 | ||
| Region 7 | Normal | 0.2% | 0 of 4 | 0 | 0 | 0 | 0 | 0 | ||
| Region 8 | Normal | 2.1% | 0 of 6 | 1 | 0 | 1 | 0 | 0 | ||
| Region 9 | Normal | 3.9% | 0 of 5 | 1 | 4 | 2 | 1 | 0 | ||
| Region 10 | Normal | 1.4% | 0 of 4 | 0 | 0 | 0 | 0 | 0 | ||
*HHS regions (Region 1 CT, ME, MA, NH, RI, VT; Region 2: NJ, NY, Puerto Rico, US Virgin Islands; Region 3: DE, DC, MD, PA, VA, WV; Region 4: AL, FL, GA, KY, MS, NC, SC, TN; Region 5: IL, IN, MI, MN, OH, WI; Region 6: AR, LA, NM, OK, TX; Region 7: IA, KS, MO, NE; Region 8: CO, MT, ND, SD, UT, WY; Region 9: AZ, CA, Guam, HI, NV; and Region 10: AK, ID, OR, WA).
† Elevated means the % of visits for ILI is at or above the national or region-specific baseline
‡ National data are for current week; regional data are for the most recent three weeks
§ Includes all 50 states, the District of Columbia, Guam, Puerto Rico, and U.S. Virgin Islands
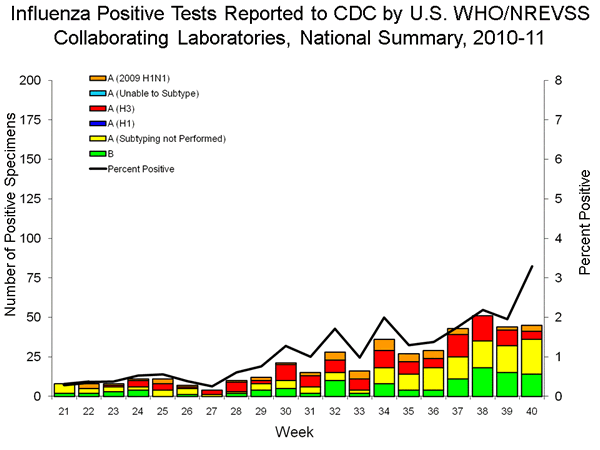
U.S. Virologic Surveillance:
WHO and NREVSS collaborating laboratories, located in all 50 states and Washington, D.C., report to CDC the number of respiratory specimens tested for influenza and the number positive by influenza type and subtype. The results of tests performed during the current week are summarized in the table below.
| Week 40 | |
|---|---|
| No. of specimens tested | 1,368 |
| No. of positive specimens (%) | 45 (3.3%) |
| Positive specimens by type/subtype | |
| Influenza A | 31 (68.9%) |
| A (2009 H1N1) | 4 (12.9%) |
| A (subtyping not performed) | 22 (71.0%) |
| A (H3) | 5 (16.1%) |
| Influenza B | 14 (31.1%) |
View WHO-NREVSS Regional Bar Charts | View Chart Data | View Full Screen | View PowerPoint Presentation
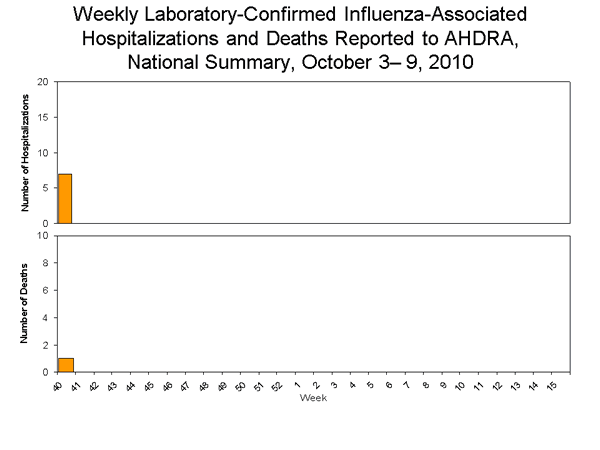
Aggregate Hospitalization and Death Reporting Activity (AHDRA):
This system tracks weekly counts of laboratory-confirmed influenza-associated hospitalizations and deaths and was implemented on August 30, 2009, during the 2009 pandemic, and ended on April 4, 2010. AHDRA surveillance during the 2010-11 season is being continued on a voluntary basis and 20 jurisdictions reported during week 40. From October 3-9, 2010, seven laboratory-confirmed influenza associated hospitalizations and one laboratory-confirmed influenza associated deaths were reported to CDC.
View Full Screen | View Chart Data | View PowerPoint Presentation
Antigenic Characterization:
A small number of isolates collected in the United States were available for antigenic characterization during the summer. CDC antigenically characterized 63 isolates collected from May 23 – September 30, 2010, including 23 2009 influenza A (H1N1), 24 influenza A (H3N2), and 16 influenza B viruses.
Twenty-two of 23 (95.7%) 2009 influenza A (H1N1) viruses tested were closely related antigenically to the influenza A (H1N1) component of the 2010-11 influenza vaccine (A/California/7/2009-like); 22 of 24 (91.7%) influenza A (H3N2) viruses tested were closely related antigenically to the influenza A (H3N2) component of the vaccine (A/Perth/16/2009-like).
Influenza B viruses currently circulating globally can be divided into two distinct lineages represented by the B/Yamagata/16/88 and B/Victoria/02/87 viruses. Twelve of 16 (75%) influenza B viruses tested belonged to Victoria-lineage and were closely related antigenically to the influenza B component of the 2010-11 influenza vaccine (B/Brisbane/60/2008-like). Four of 16 (25%) influenza B viruses tested belonged to the Yamagata-lineage.
Novel Influenza A Viruses:
No human infections with novel influenza A viruses were detected during the summer of 2010 or during week 40.
Antiviral Resistance:
Testing of 2009 influenza A (H1N1), influenza A (H3N2), and influenza B virus isolates for resistance to neuraminidase inhibitors (oseltamivir and zanamivir) is performed at CDC using a functional assay. Additional 2009 influenza A (H1N1) clinical samples are tested for a single known mutation in the neuraminidase of the virus that confers oseltamivir resistance (H275Y). The data summarized below combine the results of both test methods. These samples are routinely obtained for surveillance purposes rather than for diagnostic testing of patients with suspected antiviral resistance.
High levels of resistance to the adamantanes (amantadine and rimantadine) persist among 2009 influenza A (H1N1) and A (H3N2) viruses (the adamantanes are not effective against influenza B viruses). As a result of the sustained high levels of resistance, data from adamantane resistance testing are not presented weekly in the table below.
Antiviral Resistance Testing Results on Samples Collected Since May 23, 2010.
| Samples tested (n) | Resistant Viruses, Number (%) | Samples tested (n) | Resistant Viruses, Number (%) | |
|---|---|---|---|---|
| Oseltamivir | Zanamivir | |||
| Seasonal Influenza A (H1N1) | 0 | 0 (0.0) | 0 | 0 (0.0) |
| Influenza A (H3N2) | 37 | 0 (0.0) | 37 | 0 (0.0) |
| Influenza B | 28 | 0 (0.0) | 28 | 0 (0.0) |
| 2009 Influenza A (H1N1) | 23 | 0 (0.0) | 23 | 0 (0.0) |
Antiviral treatment with oseltamivir or zanamivir is recommended for all patients with confirmed or suspected influenza virus infection who are hospitalized or who are at higher risk for influenza complications. Additional information on antiviral recommendations for treatment and chemoprophylaxis of influenza virus infection is available at http://www.cy118119.com/flu/antivirals/index.htm.
The majority of currently circulating influenza viruses are susceptible to the neuraminidase inhibitor antiviral medications oseltamivir and zanamivir; however, rare sporadic cases of oseltamivir resistant 2009 influenza A (H1N1) and A (H3N2) viruses have been detected worldwide.? To prevent the spread of antiviral resistant virus strains, CDC reminds clinicians and the public of the need to continue hand and cough hygiene measures for the duration of any symptoms of influenza, even while taking antiviral medications (http://www.cy118119.com/mmwr/preview/mmwrhtml/mm5832a3.htm).
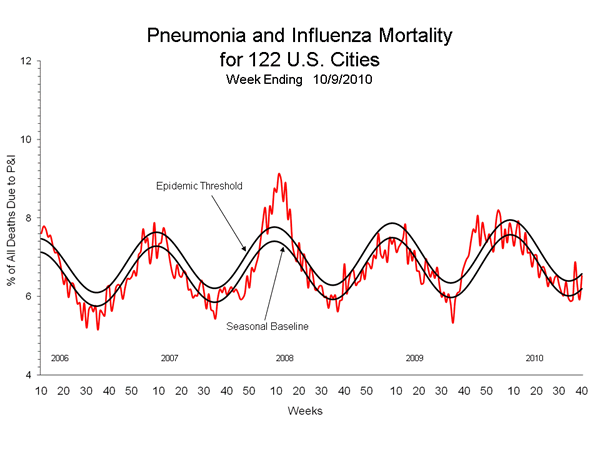
Pneumonia and Influenza (P&I) Mortality Surveillance
During week 40, 6.5% of all deaths reported through the 122-Cities Mortality Reporting System were due to P&I. This percentage was below the epidemic threshold of 6.6% for week 40.
View Full Screen | View PowerPoint Presentation
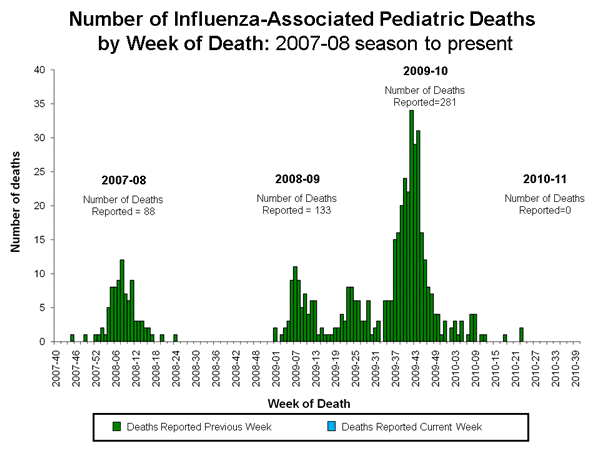
Influenza-Associated Pediatric Mortality
No influenza-associated pediatric deaths were reported to CDC during week 40, but two deaths have occurred since May 23, 2010 (Louisiana and Texas). One death was associated with an influenza A virus for which the subtype was undetermined and, one death was due to an influenza virus for which the type (A or B) was not determined. These deaths occurred during week 23 (June 6-12, 2010).
View Full Screen | View PowerPoint Presentation
Influenza-Associated Hospitalizations
The Influenza Hospitalization Network (FluSurv-NET) conducts surveillance for population-based, laboratory-confirmed influenza related hospitalizations in children (persons less than 18 years) and adults. The network covers over 80 counties in the 10 Emerging Infections Program (EIP) states (CA, CO, CT, GA, MD, MN, NM, NY, OR, and TN) and six additional states (ID, MI, OH, OK, RI and UT). FluSurv-NET estimated hospitalization rates will be updated every two weeks starting later this season.
Outpatient Illness Surveillance:
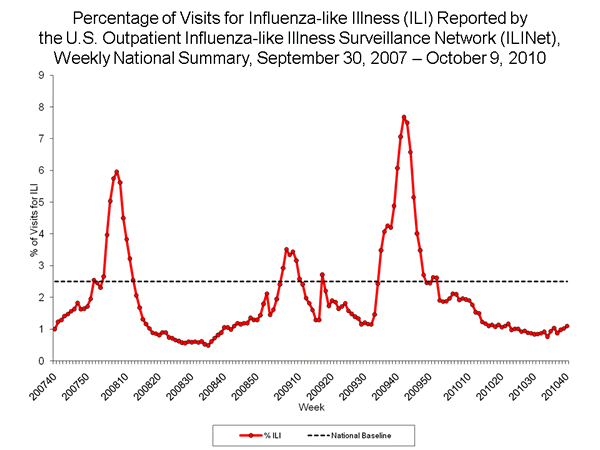
Nationwide during week 40, 1.1% of patient visits reported through the U.S. Outpatient Influenza-like Illness Surveillance Network (ILINet) were due to influenza-like illness (ILI). This percentage is below the national baseline of 2.5%.
View ILINet Regional Charts | View Chart Data | View Full Screen | View PowerPoint Presentation
On a regional level, the percentage of outpatient visits for ILI ranged from 0.4% to 1.9% during week 40. All 10 regions reported a proportion of outpatient visits for ILI below their region-specific baseline levels.
ILINet State Activity Indicator Map:
Data collected in ILINet are used to produce a measure of ILI activity* by state. Activity levels are based on the percent of outpatient visits in a state due to ILI and are compared to the average percent of ILI visits that occur during spring and fall weeks with little or no influenza virus circulation. Activity levels range from minimal, which would correspond to ILI activity from outpatient clinics being below the average, to intense, which would correspond to ILI activity from outpatient clinics being much higher than the average.
During week 40, the following influenza activity levels were experienced.
- Forty-eight states and New York City were experiencing minimal ILI activity (Alabama, Alaska, Arizona, Arkansas, California, Colorado, Connecticut, Delaware, Florida, Georgia, Hawaii, Idaho, Illinois, Indiana, Iowa, Kansas, Louisiana, Maine, Massachusetts, Michigan, Minnesota, Mississippi, Missouri, Montana, Nebraska, Nevada, New Hampshire, New Jersey, New Mexico, New York, North Carolina, North Dakota, Ohio, Oklahoma, Oregon, Pennsylvania, Rhode Island, South Carolina, South Dakota, Texas, Tennessee, Utah, Vermont, Virginia, Washington, West Virginia, Wisconsin, and Wyoming).
- Data were insufficient to calculate an ILI activity level from the District of Columbia and two states (Kentucky and Maryland).
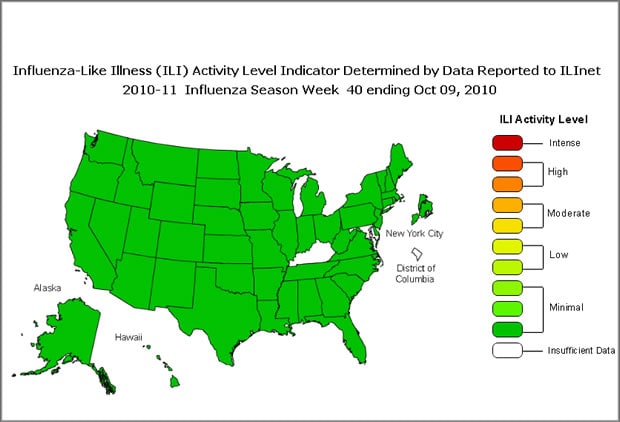
*This map uses the proportion of outpatient visits to health care providers for influenza-like illness to measure the ILI activity level within a state. It does not, however, measure the extent of geographic spread of flu within a state. Therefore, outbreaks occurring in a single city could cause the state to display high activity levels.
Data collected in ILINet may disproportionally represent certain populations within a state, and therefore may not accurately depict the full picture of influenza activity for the whole state.
Data collected in ILINet may disproportionally represent certain populations within a state, and therefore, may not accurately depict the full picture of influenza activity for the whole state.
Data displayed in this map are based on data collected in ILINet, whereas the State and Territorial flu activity map are based on reports from state and territorial epidemiologists. The data presented in this map is preliminary and may change as more data is received.
Differences in the data presented by CDC and state health departments likely represent differing levels of data completeness with data presented by the state likely being the more complete
.
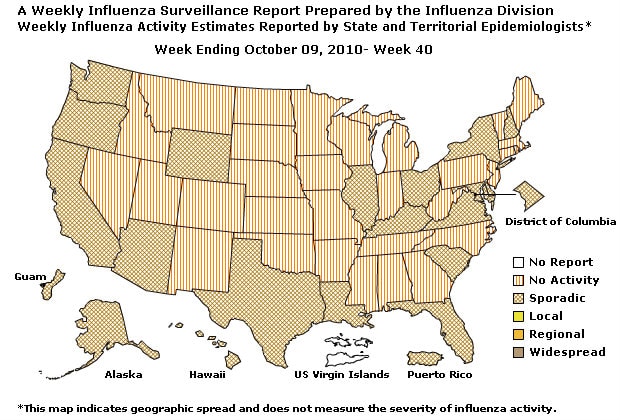
Geographic Spread of Influenza as Assessed by State and Territorial Epidemiologists:
The influenza activity reported by state and territorial epidemiologists indicates geographic spread influenza viruses, but does not measure the severity of influenza activity.
During week 40, the following influenza activity was reported:
- Sporadic influenza activity was reported by the District of Columbia, Guam, Puerto Rico, and 19 states (Alaska, Arizona, California, Delaware, Florida, Hawaii, Illinois, Kentucky, Louisiana, Maryland, New Hampshire, New York, Ohio, Oregon, South Carolina, Texas, Virginia, Washington, and Wyoming).
- No influenza activity was reported by and 31 states (Alabama, Arkansas, Colorado, Connecticut, Georgia, Idaho, Indiana, Iowa, Kansas, Maine, Massachusetts, Michigan, Minnesota, Mississippi, Missouri, Montana, Nebraska, Nevada, New Jersey, New Mexico, North Carolina, North Dakota, Oklahoma, Pennsylvania, Rhode Island, South Dakota, Tennessee, Utah, Vermont, West Virginia, and Wisconsin).
- The U.S. Virgin Islands did not report.
Additional National and International Influenza Surveillance Information
U.S. State and local influenza surveillance: Click on a jurisdiction below to access the latest local influenza information.
Distribute Project: Additional information on the Distribute syndromic surveillance project, developed and piloted by the International Society for Disease Surveillance (ISDS) now working in collaboration with CDC, to enhance and support Emergency Department (ED) surveillance, is available at http://isdsdistribute.org/
Google Flu Trends: Google Flu Trends uses aggregated Google search data in a model created in collaboration with CDC to estimate influenza activity in the U.S. For more information and activity estimates from the U.S. and worldwide, see http://www.google.org/flutrends/
Europe: for the most recent influenza surveillance information from Europe, please see WHO/Europe at http://www.euroflu.org/index.php and visit the European Centre for Disease Prevention and Control at http://ecdc.europa.eu/en/Activities/Surveillance/EISN/Pages/home.aspx
Public Health Agency of Canada: The most up to date influenza information from Canada is available at http://www.phac-aspc.gc.ca/fluwatch/
World Health Organization FluNet: Additional influenza surveillance information from participating WHO member nations is available at http://gamapserver.who.int/GlobalAtlas/home.asp
--------------------------------------------------------------------------------
A description of surveillance methods is available at: http://www.cy118119.com/flu/weekly/overview.htm
