Error processing SSI file

2010-2011 Influenza Season Week 37 ending September 17, 2011
All data are preliminary and may change as more reports are received.
U.S. Virologic Surveillance:
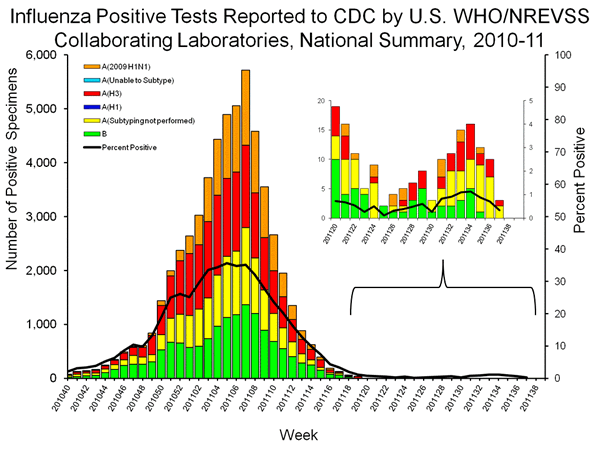
WHO and NREVSS collaborating laboratories located in all 50 states and Washington, D.C. report to CDC the number of respiratory specimens tested for influenza and the number positive by influenza type and subtype.

View Chart Data | View Full Screen | View PowerPoint Presentation
Pneumonia and Influenza (P&I) Mortality Surveillance
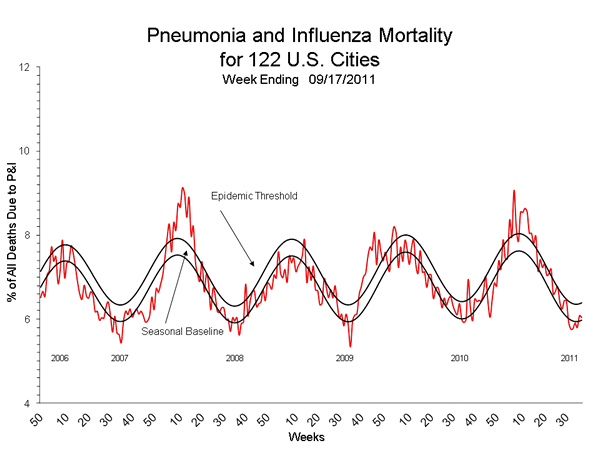
During week 37, 6.0% of all deaths reported through the 122-Cities Mortality Reporting System were due to P&I. This percentage was below the epidemic threshold of 6.4% for week 37.

View Full Screen | View PowerPoint Presentation
Influenza-Associated Pediatric Mortality
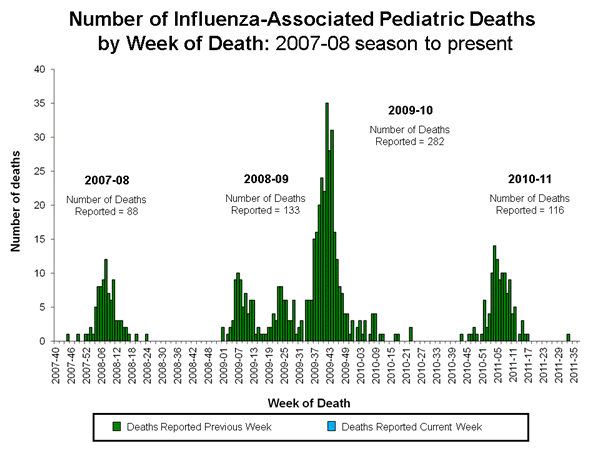
No influenza-associated pediatric deaths were reported to CDC during week 37. This season, 116 laboratory-confirmed influenza-associated pediatric deaths from 34 states, Chicago, and New York City have been reported. Forty-five of the 116 deaths reported were associated with influenza B viruses; 30 were associated with 2009 influenza A (H1N1) viruses; 21 deaths reported were associated with influenza A (H3N2) viruses, and 20 were associated with an influenza A virus for which the subtype was not determined.

View Full Screen | View PowerPoint Presentation
Outpatient Illness Surveillance:
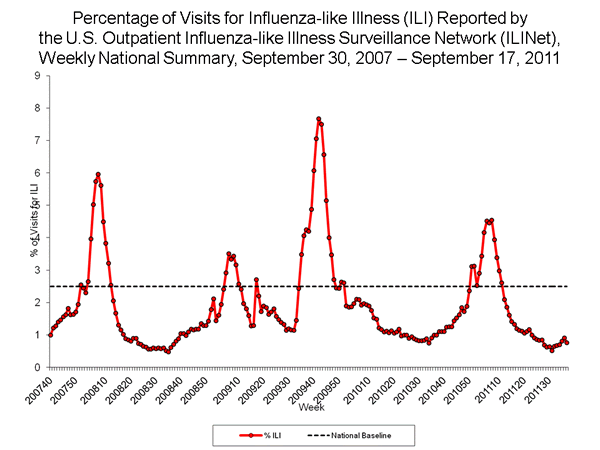
Nationwide during week 37, 0.8% of patient visits reported through the U.S. Outpatient Influenza-like Illness Surveillance Network (ILINet) were due to influenza-like illness (ILI). This percentage is below the national baseline of 2.5%.

View Chart Data | View Full Screen | View PowerPoint Presentation
A description of surveillance methods is available at: http://www.cy118119.com/flu/weekly/overview.htm


