
2009-2010 Influenza Season Summary
This summary includes information on influenza activity and virus circulation from April 19, 2009 to October 2, 2010. This time period includes both the Spring and Fall waves of the 2009 influenza A (H1N1) pandemic as well as the remainder of the 2009-10 influenza season.
From April 2009 to October 2010, 2009 influenza A (H1N1) viruses were almost exclusively identified with few seasonal influenza viruses detected during this time. 2009 influenza A (H1N1) activity peaked in October, and low levels of influenza activity were detected during the traditional winter influenza season. Influenza activity peaked in late-October and was associated with higher pediatric mortality and higher rates of hospitalizations in children and young adults than in previous seasons. The proportion of visits to health-care providers for influenza-like illness (ILI), as reported in the U.S. Outpatient Influenza-like Illness Surveillance Network (ILINet), was the highest since ILI surveillance began in 1997 in its current form. This report summarizes influenza activity in the United States during both waves of the 2009 influenza A (H1N1) pandemic and the 2009--10 influenza season (April 19, 2009—October 2, 2010).
Viral Surveillance
Since April 2009, the beginning of the 2009 H1N1 pandemic, through October 2, 2010, nearly 760,000 respiratory specimens were tested for influenza, and the number of positives was approximately four times the average of the previous four seasons. Two peaks in the percentage of specimens testing positive for influenza occurred: 43% in June during the initial pandemic wave, and 39% in October during the second wave. During April 19, 2009—October 2, 2010, World Health Organization (WHO) and National Respiratory and Enteric Virus Surveillance System (NREVSS) collaborating laboratories in the United States tested 756,728 specimens for influenza viruses; 157,449 (21%) were positive. Of the 157,449 positive specimens, 155,591 (99%) were influenza A viruses and 2,273 (1%) were influenza B viruses. Among the influenza A viruses, 117,646 (76%) were subtyped; 111,713 (95%) were 2009 pandemic H1N1, 4,199 (4%) were influenza A (H3N2), and 1,734 (2%) were seasonal influenza A (H1N1) viruses.
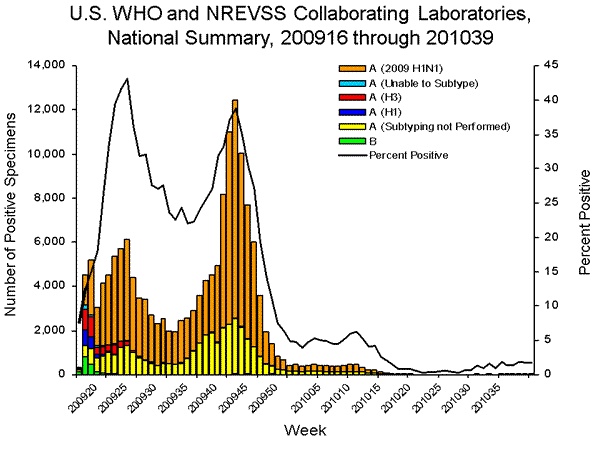
View WHO-NREVSS Regional Bar Charts | View Full Screen | View PowerPoint Presentation
Pneumonia and Influenza Hospitalization and Death Tracking
In April 2009, in response to the emergence of the 2009 pandemic H1N1 virus, the Council of State and Territorial Epidemiologists (CSTE) initiated reporting of influenza-associated hospitalizations and deaths to CDC. On August 30, 2009, CDC and CSTE instituted modified case definitions for aggregate reporting of influenza-associated hospitalizations and deaths. This cumulative jurisdiction-level reporting is referred to as the Aggregate Hospitalization and Death Reporting Activity (AHDRA).
From August 30, 2009, to April 3, 2010, a total of 41,914 laboratory-confirmed, influenza-associated hospitalizations were reported to CDC. The median number of states reporting hospitalizations per week through AHDRA was 36 (range: 29--38).
From August 30, 2009, to April 3, 2010, a total of 2,125 laboratory-confirmed, influenza-associated deaths were reported to CDC through AHDRA. The median number of states reporting influenza-associated deaths per week through AHDRA was 39 (range: 30--40).
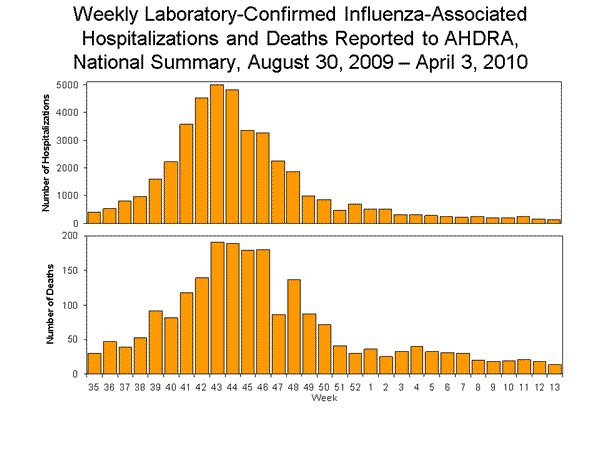
View Full Screen | View PowerPoint Presentation
Antigenic Characterization
From September 1, 2009 to May 22, 2010 (week 20), CDC antigenically characterized two seasonal influenza A (H1N1), 14 influenza A (H3N2), 43 influenza B, and 1,904 of the 2009 pandemic H1N1 viruses. Of those 2009 pandemic H1N1 viruses tested, 1,895 (99.5%) were related to the A/California/07/2009 (H1N1) reference virus selected by WHO as the monovalent 2009 pandemic H1N1 vaccine virus used during the 2009--10 season, and as a component in the 2010--11 Northern Hemisphere seasonal influenza vaccine.
Both seasonal influenza A (H1N1) viruses tested were related to A/Brisbane/59/2007, the influenza A (H1N1) component of the 2009--10 Northern Hemisphere influenza vaccine. The 14 influenza A (H3N2) viruses tested showed reduced titers with antisera produced against A/Brisbane/10/2007, the 2009--10 Northern Hemisphere influenza A (H3N2) vaccine component, and were antigenically related to A/Perth/16/2009, the WHO recommended influenza A (H3N2) component of the 2010 Southern Hemisphere and 2010--11 Northern Hemisphere vaccine formulations. Of the 43 influenza B viruses from the United States tested, 38 (88.4%) belonged to the B/Victoria lineage and were related to B/Brisbane/60/2008, the influenza B vaccine component for the 2009--10 and 2010--11 Northern Hemisphere influenza vaccine. Five (11.6%) viruses tested belonged to the B/Yamagata lineage.
Novel Influenza A Viruses
Early identification and investigation of novel influenza A cases is critical to evaluate possible human-to-human transmission. CDC conducts surveillance for human infections with novel influenza A viruses year-round and carries out extensive epidemiologic investigations on each case. During the 2009--10 season, in addition to the pandemic strain virus infections, three cases of human infection with novel influenza A viruses were identified and then characterized at CDC. These three cases, identified in Kansas, Iowa, and Minnesota, were isolated cases of human infections with swine-origin influenza A (H3N2) viruses. No additional human cases were linked to these three patients. Although the Minnesota patient reported visiting a live animal market in the days preceding illness onset (May 8, 2010), only the Kansas patient specifically reported contact with pigs in the week preceding symptom onset (July 28, 2009). The Iowa patient had onset of symptoms in September 2009. The Kansas and Iowa patients did not require hospitalization; the Minnesota patient was hospitalized. All three individuals have fully recovered.
Antiviral Resistance
In the United States, two classes of antiviral drugs are approved by the Food and Drug Administration for use in treating or preventing influenza virus infections: neuraminidase inhibitors (oseltamivir and zanamivir) and adamantanes (amantadine and rimantidine). During the 2009--10 influenza season, testing of the 2009 pandemic H1N1 viruses found that 1.1% of 4,811 tested viruses were resistant to oseltamivir. All of the oseltamivir-resistant 2009 pandemic H1N1 viruses shared a single genetic mutation conferring oseltamivir resistance.
From September 1, 2009 to May 22, 2010 (week 20), one seasonal influenza A (H1N1) virus was tested and found to be resistant to oseltamivir. No oseltamivir resistance was identified among the 19 influenza A (H3N2) or the 36 influenza B viruses tested. All tested viruses retained their sensitivity to zanamivir. Adamantane resistance continued to be high among influenza A (H3N2) viruses, with all of the 18 influenza A (H3N2) viruses tested resistant to the adamantanes. Adamantane resistance among seasonal influenza A (H1N1) viruses was not detected in the single virus tested. However, among 2009 pandemic H1N1 viruses tested, 1,895 (99.8%) of 1,899 were resistant to adamantanes.
Pneumonia- and Influenza-Related Mortality
During the 2009 H1N1 pandemic and the 2009-10 influenza season, the percentage of deaths attributed to pneumonia and influenza (P&I) exceeded the epidemic threshold for 11 consecutive weeks from September 27 to December 12, 2009, and again for three consecutive weeks from January 10 to January 30, 2010. The percentage of (P&I) deaths peaked twice, once at 8.1% during the week ending November 21, 2009, and again at 8.2% during the week ending January 23, 2010.
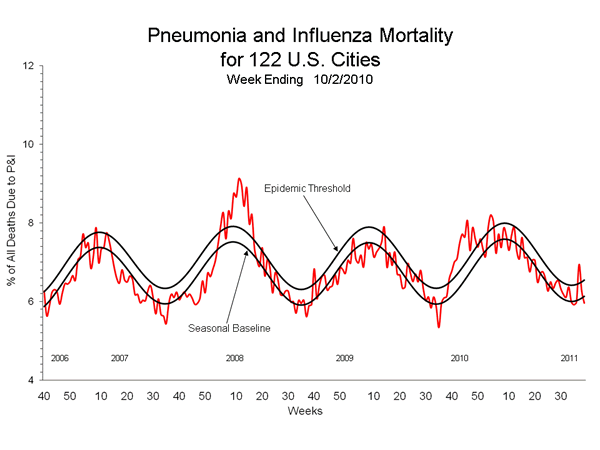
View Full Screen | View PowerPoint Presentation
Influenza-Related Pediatric Mortality
During April 19, 2009 – October 2, 2010, 348 pediatric deaths associated with laboratory-confirmed influenza occurred and were reported to CDC. These deaths were reported from 44 states, New York City, and Guam. Two hundred eight-six (82.2%) of these cases were associated with laboratory-confirmed 2009 influenza A (H1N1) virus. Fifty-six pediatric deaths were associated with an influenza A virus infection for which the subtype was undetermined, but most were likely attributable to the 2009 influenza A (H1N1) strain, based on the predominance of this strain among those circulating at the time that the deaths occurred. Two deaths were associated with a seasonal influenza A (H1) virus infection in May 2009, three deaths were associated with influenza B virus infections, and one death was associated with an influenza virus that the type was not determined. The mean and median ages of children who died were 8.7 years and 9.0 years, respectively. Twenty-four children were aged < 6 months, 42 were aged 6-23 months, 36 were aged 2-4 years, 129 were aged 5-11 years, and 117 were aged 12-17 years. Prior to the 2009 influenza A H1N1 pandemic, 67 influenza-associated pediatric deaths were reported for the 2008-09 season and 88 deaths were reported for the 2007-08 season.
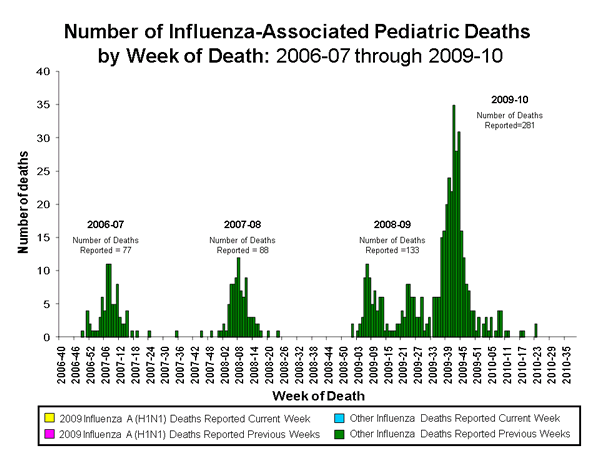
View Full Screen | View PowerPoint Presentation
Influenza-Associated Hospitalization
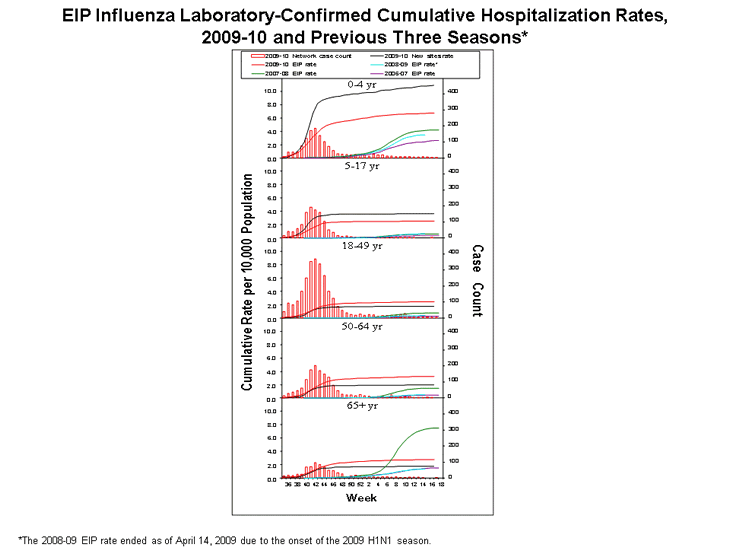
Hospitalizations associated with laboratory-confirmed influenza infections have been monitored in the Emerging Infections Program (EIP) since the 2003--04 season. Historically, EIP has included sites in 10 states. In response to the emergence of the 2009 pandemic H1N1 virus, sites in six additional states conducted surveillance and reported laboratory-confirmed influenza-associated hospitalization surveillance data. During September 1, 2009--May 1, 2010, data were collected by EIP and the new sites from a population base of nearly 26 million persons (8.5% of the U.S. population).
During September 1, 2009, through May 1, 2010, cumulative rates of laboratory-confirmed, influenza-associated hospitalization reported by the EIP sites for children aged ≤4 years and 5--17 years were 6.7 and 2.5 per 10,000, respectively. Cumulative rates of laboratory-confirmed influenza-associated hospitalization for adults aged 18--49 years, 50--64 years, and ≥65 years were 2.5, 3.2, and 2.8 per 10,000, respectively. In the new sites, cumulative rates of laboratory-confirmed, influenza-associated hospitalization rates for children aged ≤4 years and 5--17 years were 10.9 and 3.7 per 10,000, respectively. Rates for adults aged 18--49 years, 50--64 years, and ≥65 years were 1.7, 2.0, and 1.8 per 10,000, respectively. The source of rate differences between the EIP sites and the new sites are currently under investigation.
During the entire 2009 influenza A (H1N1) pandemic period, April 2009 through May 1, 2010, the cumulative rates of hospitalization for the EIP sites were 8.3 per 10,000 for ages ≤4 years, 3.4 for ages 5--17 years, 3.0 for ages 18--49 years, 3.8 for ages 50--64 years, and 3.2 for ages ≥65 years. A dramatic increase in hospitalizations in the younger age groups was indicative of the influenza pandemic's impact on children. During the past three seasons, rates have ranged from 2.6--4.2 per 10,000 for ages ≤4 years, 0.4--0.6 for ages 5--17 years, 0.3--0.7 for ages 18--49 years, 0.4--1.5 for ages 50--64, and 1.4--7.5 for ages ≥65 years.
View Full Screen | View PowerPoint Presentation
Outpatient Illness Surveillance
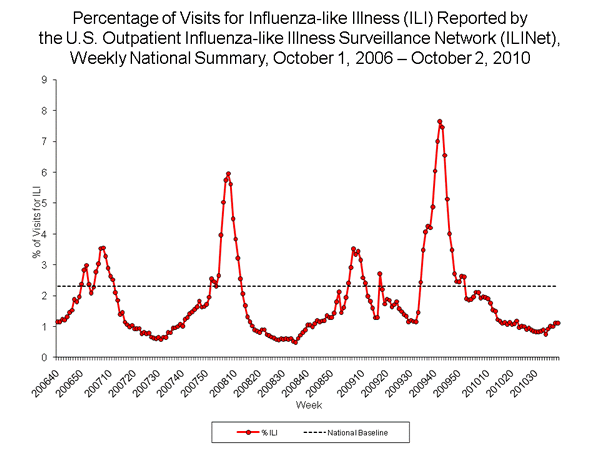
During the initial wave of 2009 pandemic H1N1 activity, the percentage of outpatient visits for ILI was at or exceeded the national baseline only during week 17, but was elevated compared with spring and summer weeks in previous years. ILI activity next exceeded the national baseline beginning week 34, and continued to be elevated above baseline through week 52, for a total of 19 consecutive weeks. ILI activity peaked at 7.7% in week 42. During the previous three influenza seasons, the peak percentage of patient visits for ILI ranged from 3.5% to 6.0% and occurred during mid- to late February.
During the 2009 H1N1 pandemic and the 2009--10 season, the peak proportion of outpatient visits to healthcare providers for ILI was among the highest seen since the system began in its current form in 1997 and was approximately equal to that seen during the 2003--04 influenza season. During the 2003--04 season, influenza A (H3N2) predominated and affected all age groups, whereas older persons were less affected during the 2009--10 season.
View ILINet Regional Charts | View Full Screen | View PowerPoint Presentation
State-Specific Activity Levels
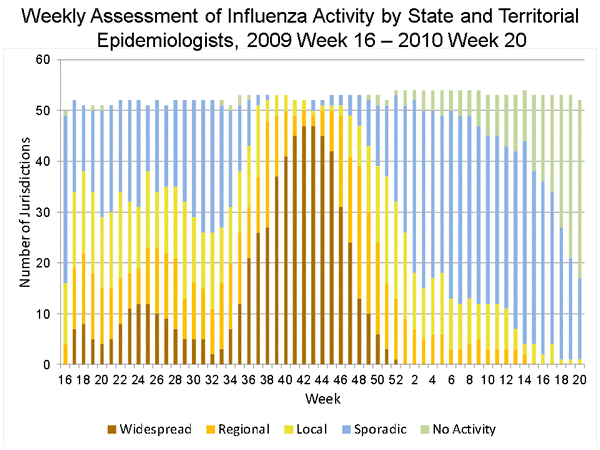
State and territorial epidemiologists report the geographic distribution of influenza in their state through a weekly influenza activity code. The geographic distribution of influenza activity was most extensive during the weeks ending October 24, 2009, when 48 states reported widespread influenza activity and all 50 states and Guam reported widespread or regional influenza activity. No jurisdictions reported widespread influenza activity by the week ending January 9, 2010.
View Full Screen | View PowerPoint Presentation
--------------------------------------------------------------------------------
A description of surveillance methods is available at: http://www.cy118119.com/flu/weekly/fluactivity.htm


