Error processing SSI file
Weekly Report: Influenza Summary Update
2008-2009 Influenza Season Week 49 ending December 6, 2008
(All data are preliminary and may change as more reports are received.)Synopsis:
During week 49 (November 30-December 6, 2008), a low level of influenza activity was reported in the United States.
- Seventy-two (2.8%) specimens tested by U.S. World Health Organization (WHO) and National Respiratory and Enteric Virus Surveillance System (NREVSS) collaborating laboratories and reported to CDC/Influenza Division were positive for influenza.
- The proportion of deaths attributed to pneumonia and influenza (P&I) was below the epidemic threshold.
- The proportion of outpatient visits for influenza-like illness (ILI) was below national and region-specific baseline levels.
- Three states reported local influenza activity; the District of Columbia, Puerto Rico and 24 states reported sporadic influenza activity; and 23 states reported no influenza activity.
Region |
Data for current week | Data cumulative for the season | ||||||
|---|---|---|---|---|---|---|---|---|
| Out-patient ILI* | % positive for flu† | Number of jurisdictions reporting regional or widespread activity‡ | A (H1) | A (H3) | A Unsub-typed | B | Pediatric Deaths | |
| Nation | Normal | 2.8 % | 0 of 51 | 157 | 18 | 233 | 99 | 0 |
| New England | Normal | 0.7 % | 0 of 6 | 0 | 1 | 6 | 1 | 0 |
| Mid-Atlantic | Normal | 0.3 % | 0 of 3 | 3 | 0 | 3 | 2 | 0 |
| East North Central | Normal | 3.4 % | 0 of 5 | 6 | 1 | 4 | 6 | 0 |
| West North Central | Normal | 0.0 % | 0 of 7 | 0 | 0 | 6 | 5 | 0 |
| South Atlantic | Normal | 2.3 % | 0 of 9 | 7 | 0 | 66 | 35 | 0 |
| East South Central | Normal | 0.5 % | 0 of 4 | 0 | 0 | 0 | 1 | 0 |
| West South Central | Normal | 3.5 % | 0 of 4 | 25 | 0 | 71 | 33 | 0 |
| Mountain | Normal | 3.3 % | 0 of 8 | 5 | 11 | 16 | 5 | 0 |
| Pacific | Normal | 3.6 % | 0 of 5 | 111 | 5 | 61 | 11 | 0 |
* Elevated means the % of visits for ILI is at or above the national or
region-specific baseline
† National data is for current week; regional data is for the most recent three weeks.
‡ Includes all 50 states and the District of Columbia
U.S. Virologic Surveillance:
WHO and NREVSS collaborating laboratories located in all 50 states and Washington D.C. report to CDC the number of respiratory specimens tested for influenza each week. Results of these tests performed during the current week and cumulative totals for the season are summarized in the table below.
| Week 49 | Cumulative for the Season | |
|---|---|---|
| No. of specimens tested | 2585 | 31394 |
| No. of positive specimens (%) | 72 (2.8%) | 507 (1.6%) |
| Positive specimens by type/subtype | ||
| Influenza A | 62 (86.1%) | 408 (80.5%) |
| A (H1) | 12 (19.4%) | 157 (38.5%) |
| A (H3) | 3 (4.8%) | 18 (4.4%) |
| A (unsubtyped) | 47 (75.8%) | 233 (57.1%) |
| Influenza B | 10 (13.9%) | 99 (19.5%) |
Thirty states from all nine surveillance regions have reported laboratory-confirmed influenza this season with three states accounting for 392 (77.3%) of the 507 reported influenza viruses.
View Chart Data | View Full Screen
Antigenic Characterization:
CDC has antigenically characterized 36 influenza viruses [20 influenza A (H1), three influenza A (H3) and 13 influenza B viruses] collected by U.S. laboratories since October 1, 2008.
All influenza A (H1) viruses were characterized as A/Brisbane/59/2007-like and all influenza A (H3) viruses were characterized as A/Brisbane/10/2007-like, the influenza A (H1N1) and influenza A (H3N2) components included in the 2008-09 influenza vaccine.
Influenza B viruses currently circulating can be divided into two antigenically distinct lineages represented by the B/Yamagata/16/88 and B/Victoria/02/87 viruses. Four influenza B viruses were characterized as B/Florida/04/2006-like, belonging to the B/Yamagata lineage, the influenza B component of the 2008-09 influenza vaccine. The remaining nine viruses belong to the B/Victoria lineage. Eight of the nine viruses belonging to the B/Victoria lineage were from one state.
Data on antigenic characterization should be interpreted with caution given that:
- Few U.S. isolates are available for testing because of limited flu activity thus far.
- The majority of viruses antigenically characterized to date come from only two states and may not be nationally representative.
- Antigenic characterization data is based on hemagglutination inhibition (HI) testing using a panel of reference ferret antisera and results may not correlate with clinical protection against circulating viruses provided by influenza vaccination.
Annual influenza vaccination is expected to provide the best protection against those virus strains which are most similar to the vaccine strains, but can also provide at least partial protection against strains that are related, but antigenically distinct from vaccine strains. Limited to no protection may be expected when the vaccine and circulating virus strains are so different as to be from different lineages, as is seen with the two lineages of influenza B viruses.
Antiviral Resistance:
Since October 1, 2008, 46 influenza A (H1N1), seven influenza A (H3N2), and 15 influenza B viruses from 15 states have been tested for antiviral resistance; however, 63% of the viruses tested were from only two states. Forty-five of 46 influenza A (H1N1) viruses tested were resistant to oseltamivir; while all 46 viruses were sensitive to zanamivir. All influenza A (H3N2) and B viruses tested were sensitive to oseltamivir and zanamivir.
Twenty-five influenza A (H1N1) and five influenza A (H3N2) viruses were tested for adamantane resistance. All influenza A (H1N1) viruses were sensitive to the adamantanes. All influenza A (H3N2) viruses tested were resistant to the adamantanes. The adamantanes are not effective against influenza B viruses.
Three states have reported local influenza activity during the 2008-09 season in the United States to date, thus the number of virus specimens available for antiviral resistance testing is limited in both the overall number tested and in the number of states that have submitted specimens. Limited data on antiviral resistance, as well as the uncertainty regarding which influenza virus types or subtypes will circulate during the season, make it too early to make an accurate determination of the prevalence of influenza viruses resistance to oseltamivir or the adamantanes (amantadine and rimantadine) nationally or regionally at this time. CDC has solicited a representative sample of viruses from WHO collaborating laboratories in the United States, and more specimens are expected as influenza activity increases.
Pneumonia and Influenza (P&I) Mortality Surveillance
During week 49, 6.5% of all deaths reported through the 122-Cities Mortality Reporting System were due to P&I. This percentage is below the epidemic threshold of 7.2% for week 49.
View Full Screen
Influenza-Associated Pediatric Mortality
No influenza-associated pediatric deaths were reported during week 48.
View Full Screen
Influenza-Associated Hospitalizations
Laboratory-confirmed influenza-associated hospitalizations are monitored in two population-based surveillance networks: the Emerging Infections Program (EIP) and the New Vaccine Surveillance Network (NVSN).
No influenza-associated hospitalizations have been reported from the New Vaccine Surveillance Network this season.
| Season | 0-4 years (Rate per 10,000) |
5-17 years (Rate per 10,000) |
18-49 years (Rate per 10,000) |
50-64 years (Rate per 10,000) |
≥ 65 years (Rate per 10,000) |
|---|---|---|---|---|---|
| 2005-06 | 0.1 | 0.002 | 0.01 | 0.01 | 0.08 |
| 2006-07 | 0.1 | 0.01 | 0.01 | 0.02 | 0.11 |
| 2007-08 | 0.25 | 0.02 | 0.02 | 0.03 | 0.19 |
| 2008-09* | 0.24 | 0.01 | 0.02 | 0.03 | 0.09 |
View Full Screen
Outpatient Illness Surveillance:
During week 49, 1.3% of patient visits reported through the U.S. Outpatient Influenza-like Illness Surveillance Network (ILINet) (formerly known as the U.S. Influenza Sentinel Provider Surveillance Network) were due to influenza-like illness (ILI). This percentage is less than the national baseline of 2.4%. On a regional level, the percentage of visits for ILI ranged from 0.4% to 1.9%. All nine regions reported percentages of visits for ILI below their respective region-specific baselines.
View Chart Data |View Full Screen
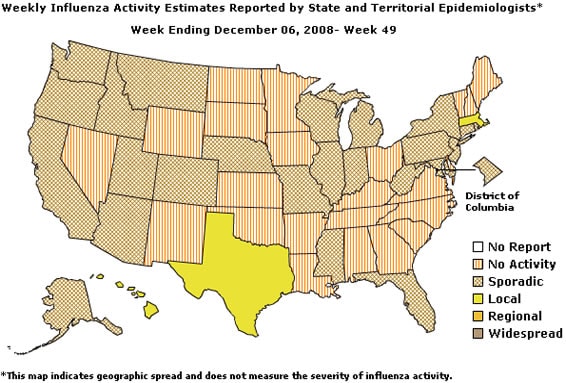
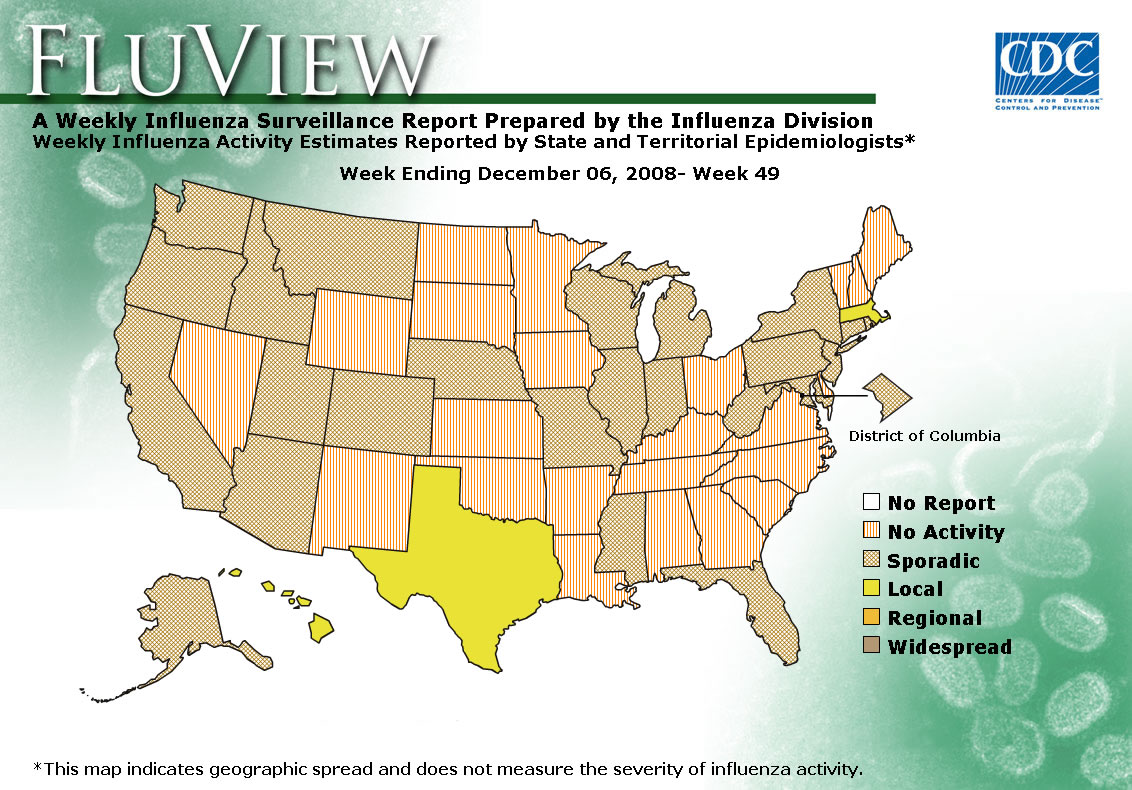
Geographic Spread of Influenza as Assessed by State and Territorial Epidemiologists:
During week 49 the following influenza activity was reported:
- Local influenza activity was reported by three states (Hawaii, Massachusetts, and Texas).
- Sporadic activity was reported in the District of Columbia, Puerto Rico, and 24 states (Alaska, Arizona, California, Colorado, Connecticut, Florida, Idaho, Illinois, Indiana, Maryland, Michigan, Mississippi, Missouri, Montana, Nebraska, New Jersey, New York, Oregon, Pennsylvania, Rhode Island, Utah, West Virginia, Washington, and Wisconsin).
- No influenza activity was reported in 23 states (Alabama, Arkansas, Delaware, Georgia, Iowa, Kansas, Kentucky, Louisiana, Maine, Minnesota, Nevada, New Hampshire, New Mexico, North Carolina, North Dakota, Ohio, Oklahoma, South Carolina, South Dakota, Tennessee, Vermont, Virginia, and Wyoming).
--------------------------------------------------------------------------------
A description of surveillance methods is available at: http://www.cy118119.com/flu/weekly/fluactivity.htm
- Page last updated December 12, 2008. Error processing SSI file