Error processing SSI file
Weekly Report: Influenza Summary Update
2008-2009 Influenza Season Week 47, ending November 22, 2008
(All data are preliminary and may change as more reports are received.)Synopsis:
During week 47 (November 16-22, 2008), a low level of influenza activity was reported in the United States.
- Fifty-two (2.5%) specimens tested by U.S. World Health Organization (WHO) and National Respiratory and Enteric Virus Surveillance System (NREVSS) collaborating laboratories and reported to CDC/Influenza Division were positive for influenza.
- The proportion of deaths attributed to pneumonia and influenza (P&I) was below the epidemic threshold.
- The proportion of outpatient visits for influenza-like illness (ILI) was below national and region-specific baseline levels.
- One state reported local influenza activity; the District of Columbia and 19 states reported sporadic influenza activity; 29 states reported no influenza activity; and one state did not report.
Region |
Data for current week | Data cumulative for the season | ||||||
|---|---|---|---|---|---|---|---|---|
| Out-patient ILI* | % positive for flu† | Number of jurisdictions reporting regional or widespread activity‡ | A (H1) | A (H3) | A Unsub-typed | B | Pediatric Deaths | |
| Nation | Normal | 2.5 % | 0 of 51 | 101 | 14 | 128 | 66 | 0 |
| New England | Normal | 0.5 % | 0 of 6 | 0 | 1 | 2 | 1 | 0 |
| Mid-Atlantic | Normal | 0.1 % | 0 of 3 | 2 | 0 | 2 | 1 | 0 |
| East North Central | Normal | 5.3 % | 0 of 5 | 4 | 0 | 3 | 6 | 0 |
| West North Central | Normal | 0.3 % | 0 of 7 | 0 | 0 | 2 | 1 | 0 |
| South Atlantic | Normal | 1.8 % | 0 of 9 | 8 | 2 | 45 | 23 | 0 |
| East South Central | Normal | 0.0 % | 0 of 4 | 0 | 0 | 0 | 0 | 0 |
| West South Central | Normal | 3.6 % | 0 of 4 | 10 | 0 | 28 | 20 | 0 |
| Mountain | Normal | 1.2 % | 0 of 8 | 2 | 7 | 7 | 4 | 0 |
| Pacific | Normal | 5.4 % | 0 of 5 | 75 | 4 | 39 | 10 | 0 |
* Elevated means the % of visits for ILI is at or above the national or
region-specific baseline
† National data is for current week; regional data is for the most recent three weeks.
‡ Includes all 50 states and the District of Columbia
U.S. Virologic Surveillance:
During week 47, WHO and NREVSS laboratories located in all 50 states and Washington D.C. reported 2,080 specimens tested for influenza viruses, 52 of which were positive: ten influenza A (H1) viruses, 26 influenza A viruses that were not subtyped, and 16 influenza B viruses. Twenty-five states from eight of the nine surveillance regions have reported laboratory-confirmed influenza this season with three states accounting for 235 (76.1%) of the 309 reported influenza viruses.
View Chart Data | View Full Screen
Antigenic Characterization:
CDC has antigenically characterized 21 influenza viruses [20 influenza A (H1) and one influenza B virus] collected by U.S. laboratories since October 1, 2008. All influenza A (H1) viruses were antigenically related to A/Brisbane/59/2007, the A (H1N1) component selected for the 2008-09 influenza vaccine. The influenza B virus was characterized as B/Florida/04/2006-like, the influenza B component of the 2008-09 influenza vaccine.
It is too early in the influenza season to determine which influenza viruses will predominate or how well the vaccine and circulating strains will match.
Antiviral Resistance:
Since October 1, 2008, 21 influenza A (H1N1), five influenza A (H3N2), and eight influenza B viruses from eight states have been tested for antiviral resistance; however, 71% of the viruses tested were from only two states. Twenty of 21 influenza A (H1N1) viruses tested were resistant to oseltamivir; all 21 viruses were sensitive to zanamivir. All influenza A (H3N2) and B viruses tested were sensitive to oseltamivir and zanamivir.
Six influenza A (H1N1) and four influenza A (H3N2) viruses were tested for adamantane resistance. All influenza A (H1N1) viruses were sensitive to adamantanes and all influenza A (H3N2) viruses tested were resistant to adamantanes. The adamantanes are not effective against influenza B viruses.
Only one state has reported local influenza activity during the 2008-09 season in the United States to date, thus the number of virus specimens available for antiviral resistance testing is limited in both overall number tested and in the number of states that have submitted specimens. Currently, data on antiviral resistance, as well as the limited information on which influenza virus types or subtypes will circulate during the season, are insufficient to provide an indication of the prevalence of oseltamivir or adamantane (amantadine and rimantadine) resistance at a national or regional level. CDC has solicited a representative sample of viruses from WHO collaborating laboratories in the United States, and more specimens are expected as influenza activity increases.
Pneumonia and Influenza (P&I) Mortality Surveillance
During week 47, 6.4% of all deaths reported through the 122-Cities Mortality Reporting System were due to P&I. This percentage is below the epidemic threshold of 7.0% for week 47
View Full Screen
Influenza-Associated Pediatric Mortality
No influenza-associated pediatric deaths were reported during week 47.
View Full Screen
Influenza-Associated Hospitalizations
Laboratory-confirmed influenza-associated hospitalizations are monitored in two population-based surveillance networks: the Emerging Infections Program (EIP) and the New Vaccine Surveillance Network (NVSN). EIP and NVSN estimated rates of hospitalization for influenza will be reported every two weeks starting later this season.
Outpatient Illness Surveillance:
During week 47, 1.3% of patient visits reported through the U.S. Outpatient Influenza-like Illness Surveillance Network (ILINet) (formerly known as the U.S. Influenza Sentinel Provider Surveillance Network) were due to influenza-like illness (ILI). This percentage is less than the national baseline of 2.4%. On a regional level, the percentage of visits for ILI ranged from 0.6% to 2.4%. All nine regions reported percentages of visits for ILI below their respective region-specific baselines.
View Chart Data |View Full Screen
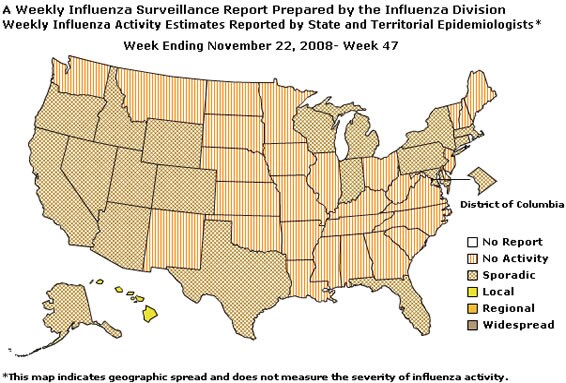
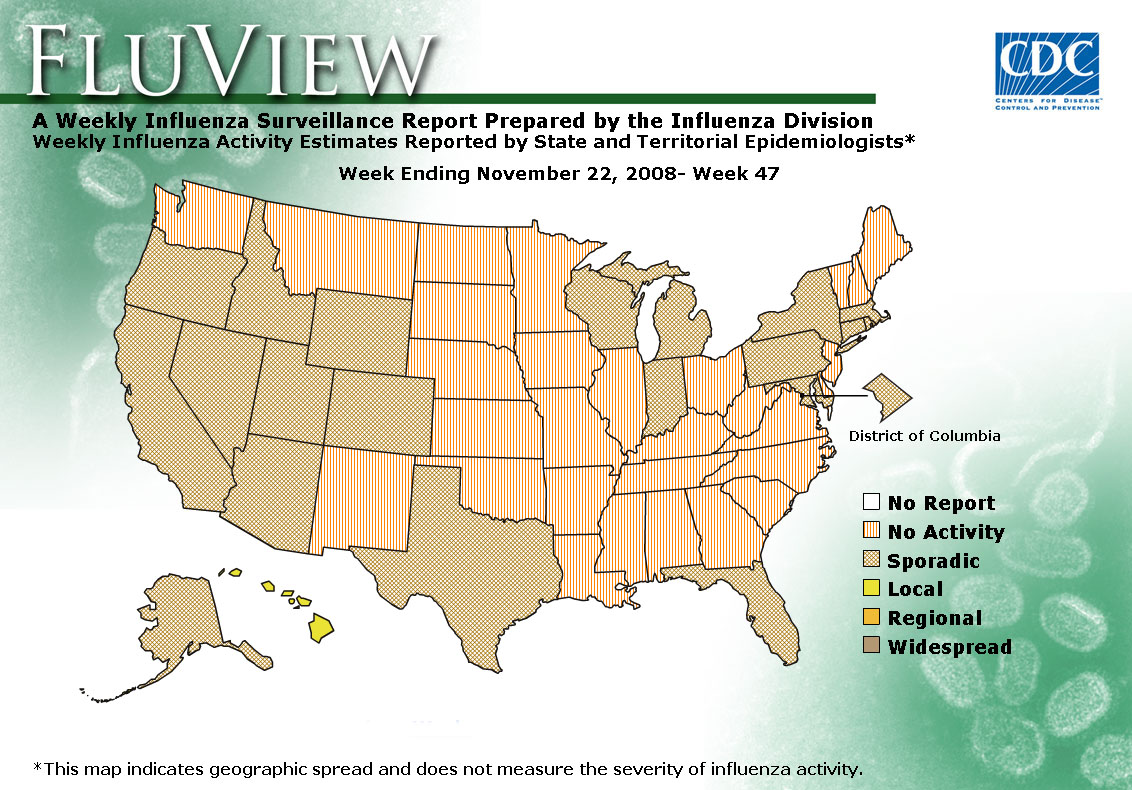
Geographic Spread of Influenza as Assessed by State and Territorial Epidemiologists:
During week 47 the following influenza activity was reported:
- Local influenza activity was reported by one state (Hawaii)
- Sporadic activity was reported in the District of Columbia and 19 states (Alaska, Arizona, California, Colorado, Connecticut, Florida, Idaho, Indiana, Massachusetts, Maryland, Michigan, Nevada, New York, Oregon, Pennsylvania, Texas, Utah, Wisconsin, and Wyoming).
- No influenza activity was reported in 29 states (Alabama, Arkansas, Delaware, Georgia, Illinois, Iowa, Kansas, Kentucky, Louisiana, Maine, Minnesota, Mississippi, Missouri, Montana, Nebraska, New Hampshire, New Jersey, New Mexico, North Carolina, North Dakota, Ohio, Oklahoma, South Carolina, South Dakota, Tennessee, Vermont, Virginia, Washington, and West Virginia).
- One state (Rhode Island) did not report.
--------------------------------------------------------------------------------
A description of surveillance methods is available at: http://www.cy118119.com/flu/weekly/fluactivity.htm
- Page last updated November 28, 2008. Error processing SSI file