Error processing SSI file
Weekly Report: Influenza Summary Update
2008-2009 Influenza Season Week 40, ending October 4, 2008
(All data are preliminary and may change as more reports are received.)Background:
The Centers for Disease Control and Preventions (CDC) Influenza Division collects and analyzes surveillance data year-round and produces a weekly report on U.S. influenza activity from October through May. The U.S. influenza surveillance system consists of information in five different categories collected from nine different data sources.
- The five categories of influenza surveillance consist of:
- Viral Surveillance: U.S. World Health Organization (WHO) collaborating laboratories, the National Respiratory and Enteric Virus Surveillance System (NREVSS), and novel influenza A virus case reporting;
- Outpatient Illness Surveillance: US Outpatient Influenza-like Illness Surveillance Network;
- Mortality: 122-Cities Mortality Reporting System and influenza-associated pediatric mortality;
- Hospitalizations: Emerging Infections Program and the New Vaccine Surveillance Network; and,
- Summary of geographic spread of influenza: state and territorial epidemiologists?reports.
US Virologic Surveillance:
From week 21 through week 39 (weeks ending May 18 ?September 27), WHO and NREVSS laboratories located in all 50 states and Washington DC tested 25,031 specimens for influenza and 179 (0.7%) were positive. Influenza positive tests were reported from all nine public health surveillance regions during the summer. Of the positive results, 6 (3.4%) were influenza A (H1) viruses, 21 (11.7%) were influenza A (H3) viruses, 80 (44.7%) were influenza A viruses that were not subtyped, and 72 (40.2%) were influenza B viruses. More than half (63%) of these isolates were tested from mid-May through late July. Of the 40 influenza viruses reported during September (weeks 36-39), one (2.5%) was an influenza A (H1) virus, four (10.0%) were influenza A (H3) viruses, 29 (72.5%) were influenza A viruses that were not subtyped, and six (15.0%) were influenza B viruses.
Since September 30, 2007, WHO and NREVSS laboratories have tested a total of 218,493 specimens for influenza viruses and 39,407 (18.0%) were positive. Among the 39,407 influenza viruses, 28,091 (71.3%) were influenza A viruses and 11,316 (28.7%) were influenza B viruses. Eight thousand two hundred seventy-two (29.4%) of the 28,091 influenza A viruses have been subtyped: 2,173 (26.3%) were influenza A (H1) viruses and 6,099 (73.7%) were influenza A (H3) viruses.
During week 40, WHO and NREVSS laboratories reported 1,123 specimens tested for influenza viruses, eight of which were positive: five influenza A viruses that were not subtyped (Mountain, Pacific, South Atlantic and West South Central regions) and three influenza B virus (Mountain and South Atlantic regions).
View Chart Data | View Full Screen
Antigenic Characterization:
A small number of isolates were available for antigenic characterization during the summer. CDC antigenically characterized six isolates collected from May 18 ?September 27, including four influenza A (H1), one influenza A (H3), and one influenza B viruses. All six viruses are antigenically similar to the components selected for the 2008-09 influenza vaccine (A/Brisbane/59/2007-like (H1N1), A/Brisbane/10/2007-like (H3N2), and B/Florida/04/2006-like).
Novel Influenza A Viruses:
No novel influenza A virus infections were reported during the summer of 2008 or for week 40.
Antiviral Resistance:
In the United States, two groups of antiviral drugs have been approved by FDA for use in treating or preventing influenza virus infections. These two groups of antiviral drugs are: neuraminidase inhibitors (oseltamivir and zanamivir) and adamantanes (amantadine and rimantadine). A description of these drugs can be found at: http://www.cy118119.com/flu/protect/antiviral/index.htm.
A small number of isolates collected since May 18 were sent to CDC for antiviral resistance testing during the summer.
Neuraminidase Inhibitor Antiviral Drugs: CDC performed antiviral resistance testing on 10 influenza A and B viruses collected since May 18. Two of the six influenza A (H1N1) viruses tested were found to be resistant to oseltamivir. No oseltamivir resistance has been detected in influenza A (H3N2) or influenza B viruses, and all tested viruses retain their sensitivity to zanamivir. Additional information on antiviral resistance can be found at: http://www.cy118119.com/flu/about/qa/antiviralresistance.htm
Adamantane Antiviral Drugs:Six influenza A viruses collected since May 18 have been tested for adamantane resistance. The one influenza A (H3N2) virus tested and one of the five influenza A (H1N1) viruses tested were resistant to the adamantanes. The adamantanes are not effective against influenza B viruses.
Based on the level of oseltamivir resistance observed in only one influenza subtype, H1N1, and the persisting high levels of resistance to the adamantanes in H3N2 viruses, CDC continues to recommend the use of oseltamivir and zanamivir for the treatment or prevention of influenza. Use of amantadine or rimantadine is not recommended. Guidance on influenza antiviral use can be found at: http://www.cy118119.com/mmwr/preview/mmwrhtml/rr5606a1.htm
Pneumonia and Influenza (P&I) Mortality Surveillance
No influenza-associated pediatric deaths were reported for week 40.
View Full Screen
Influenza-Associated Pediatric Mortality
No influenza-associated pediatric deaths were reported for week 40.
View Full Screen
Influenza-Associated Hospitalizations
Laboratory-confirmed influenza-associated hospitalizations are monitored in two population-based surveillance networks: the Emerging Infections Program (EIP) and the New Vaccine Surveillance Network (NVSN). EIP and NVSN estimated rates of hospitalization for influenza will be reported every two weeks starting later this season.
Outpatient Illness Surveillance:
During week 40, 0.8% of patient visits reported through the US Outpatient Influenza-like Illness Surveillance Network (ILINet), formally known as the US Influenza Sentinel Provider Surveillance Network, were due to influenza-like illness (ILI). This percentage is less than the national baseline of 2.4%. On a regional level, the percentage of visits for ILI ranged from 0.3% to 1.6%. All nine regions reported percentages of visits for ILI below their respective region-specific baselines.
View Chart Data |View Full Screen
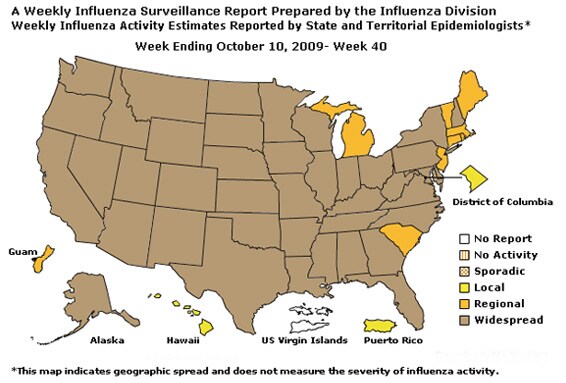
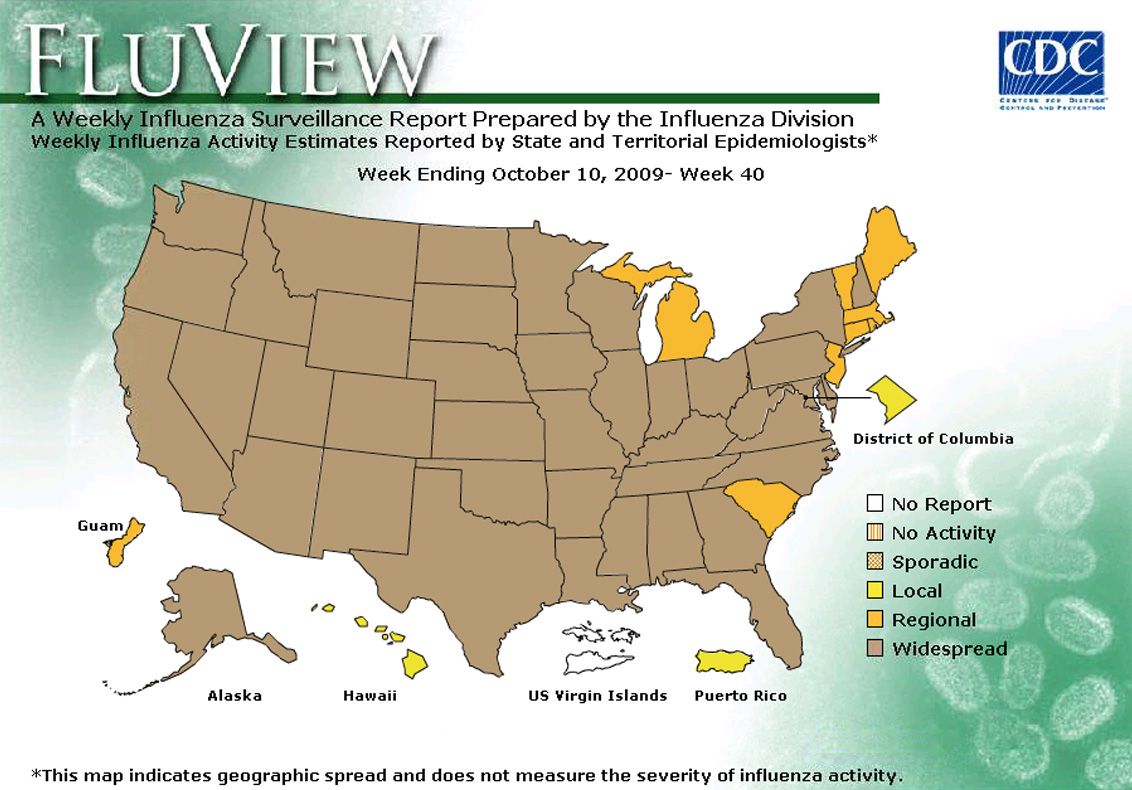
Geographic Spread of Influenza as Assessed by State and Territorial Epidemiologists:
During week 40 the following influenza activity was reported:
- Sporadic activity was reported in seven states (California, Connecticut, Florida, Hawaii, Idaho, New York, and Wyoming).
- No influenza activity was reported in 41states (Alabama, Alaska, Arizona, Arkansas, Colorado, Delaware, Georgia, Illinois, Indiana, Iowa, Kansas, Kentucky, Louisiana, Maine, Maryland, Massachusetts, Michigan, Minnesota, Mississippi, Missouri, Nebraska, Nevada, New Hampshire, New Jersey, New Mexico, North Carolina, North Dakota, Ohio, Oklahoma, Oregon, Pennsylvania, Rhode Island, South Carolina, South Dakota, Tennessee, Texas, Utah, Vermont, Virginia, Wisconsin, and West Virginia) and the District of Columbia.
- Two states (Montana and Washington) did not report.
--------------------------------------------------------------------------------
A description of surveillance methods is available at: http://www.cy118119.com/flu/weekly/fluactivity.htm
- Page last updated October 10, 2008. Error processing SSI file