Error processing SSI file
Error processing SSI file
Weekly Report: Influenza Summary Update
Week ending December 23, 2006-Week 51
Error processing SSI fileSynopsis:
During week 51 (December 17 ?December 23, 2006)*, influenza activity increased in the United States. Among specimens tested by U.S. World Health Organization (WHO) and National Respiratory and Enteric Virus Surveillance System (NREVSS) collaborating laboratories for influenza, 10.1% were positive. Four states reported widespread influenza activity; twelve states reported regional influenza activity; five states and the District of Columbia reported local influenza activity; 25 states and New York City reported sporadic influenza activity; one state reported no influenza activity, and three states did not report. The reporting of widespread or regional influenza activity increased from 12 states for week 50 to 17 states for week 51. On a national level, laboratory and outpatient influenza-like illness (ILI) surveillance data indicated an increase from week 49 to week 51, and ILI was above baseline for the second consecutive week this season. One influenza-associated pediatric death was reported during week 51. However, the percent of deaths due to pneumonia and influenza remained below baseline level.
Laboratory Surveillance*:
During week 51, WHO and NREVSS laboratories reported 1,926 specimens tested for influenza viruses, 195 (10.1%) of which were positive: 72 influenza A (H1) viruses, 1 influenza A (H3) virus, 77 influenza A viruses that were not subtyped, and 45 influenza B viruses.
Since October 1, 2006, WHO and NREVSS laboratories have tested a total of 37,281 specimens for influenza viruses and 1,571 (4.2%) were positive. Among the 1,571 influenza viruses, 1,250 (79.6%) were influenza A viruses and 321 (20.4%) were influenza B viruses. Three hundred seventy-six (30.1%) of the 1,250 influenza A viruses have been subtyped: 359 (95.5%) were influenza A (H1) viruses and 17 (4.5%) were influenza A (H3) viruses. Among specimens tested for influenza during the most recent 3 weeks (December 3-23, 2006), on a regional basis, the percent of specimens testing positive for influenza exceeded 10% in the East North Central (10.3%), South Atlantic (17.1%), and East South Central (21.9%) regions. The percent of specimens tested in the most recent 3 weeks testing positive for influenza was below 10% in the remaining six regions and ranged from 0.8% to 4.9%.
View
Chart Data |
View
Full Screen
Antigenic Characterization:
CDC has antigenically characterized 62 influenza viruses [24 influenza A (H1), 1 influenza A (H3), and 37 influenza B viruses] collected by U.S. laboratories since October 1, 2006.
Influenza A (H1) [24]It is too early in the influenza season to determine which influenza viruses will predominate or how well the vaccine and circulating strains will match.?Twenty-one of the 24 viruses characterized were similar to A/New Caledonia/20/99-like, which is the influenza A (H1) component of the 2006-07 influenza vaccine.Influenza A (H3) [1]
?Three of the 24 viruses showed somewhat reduced titers with antisera produced against A/New Caledonia/20/99.?The virus was characterized as A/Wisconsin/67/2005-like, which is the influenza A (H3) component of the 2006-07 influenza vaccine.Influenza B (B/Victoria/02/87 and B/Yamagata/16/88 lineages) [37]Victoria lineage [22]
?Twenty-two (59%) of the 37 influenza B viruses characterized belong to the B/Victoria lineage of viruses.o Nine (41%) of these 22 viruses were similar to B/Ohio/01/2005, the B component of the 2006-07 influenza vaccine.Yamagata lineage [15]
o Thirteen (59%) of these 22 viruses showed somewhat reduced titers with antisera produced against B/Ohio/01/2005.
?Fifteen (41%) of the 37 influenza B viruses characterized belong to the B/Yamagata lineage of viruses.
Pneumonia and Influenza (P&I) Mortality Surveillance*:
During week 51, 6.1% of all deaths were reported as due to pneumonia or influenza. This percentage is below the epidemic threshold of 7.4% for week 51.
Influenza-Associated Pediatric Mortality*:
One influenza-associated pediatric death was reported for week 51.
Influenza-Associated Pediatric Hospitalizations*:
Laboratory-confirmed influenza-associated pediatric hospitalizations are monitored in two population-based surveillance networks?/sup>: the Emerging Infections Program (EIP) and the New Vaccine Surveillance Network (NVSN). No influenza-associated pediatric hospitalizations have been reported from either network this season.
Influenza-like Illness Surveillance*:
During week 51, 3.2%*** of patient visits to U.S. sentinel providers were due to ILI. This percentage is above the national baseline**** of 2.1%. On a regional level**, the percentage of visits for ILI ranged from 1.5% to 7.3%. Seven regions reported ILI above their region-specific baseline****: the New England region reported 1.5% compared to its baseline of 1.2%, the East North Central region reported 2.1% compared to its baseline of 1.9%, the West North Central region reported 2.1% compared to its baseline of 1.5%, the South Atlantic region reported 2.9% compared to its baseline of 2.3%, the East South Central region reported 5.0% compared to its baseline of 2.4%, the West South Central region reported 7.3% compared to its baseline of 3.0%, and the Mountain region reported 2.0.% compared to its baseline of 1.7%.
View
Chart Data
| View Full Screen
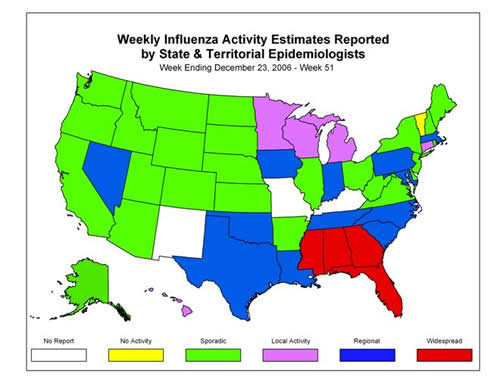
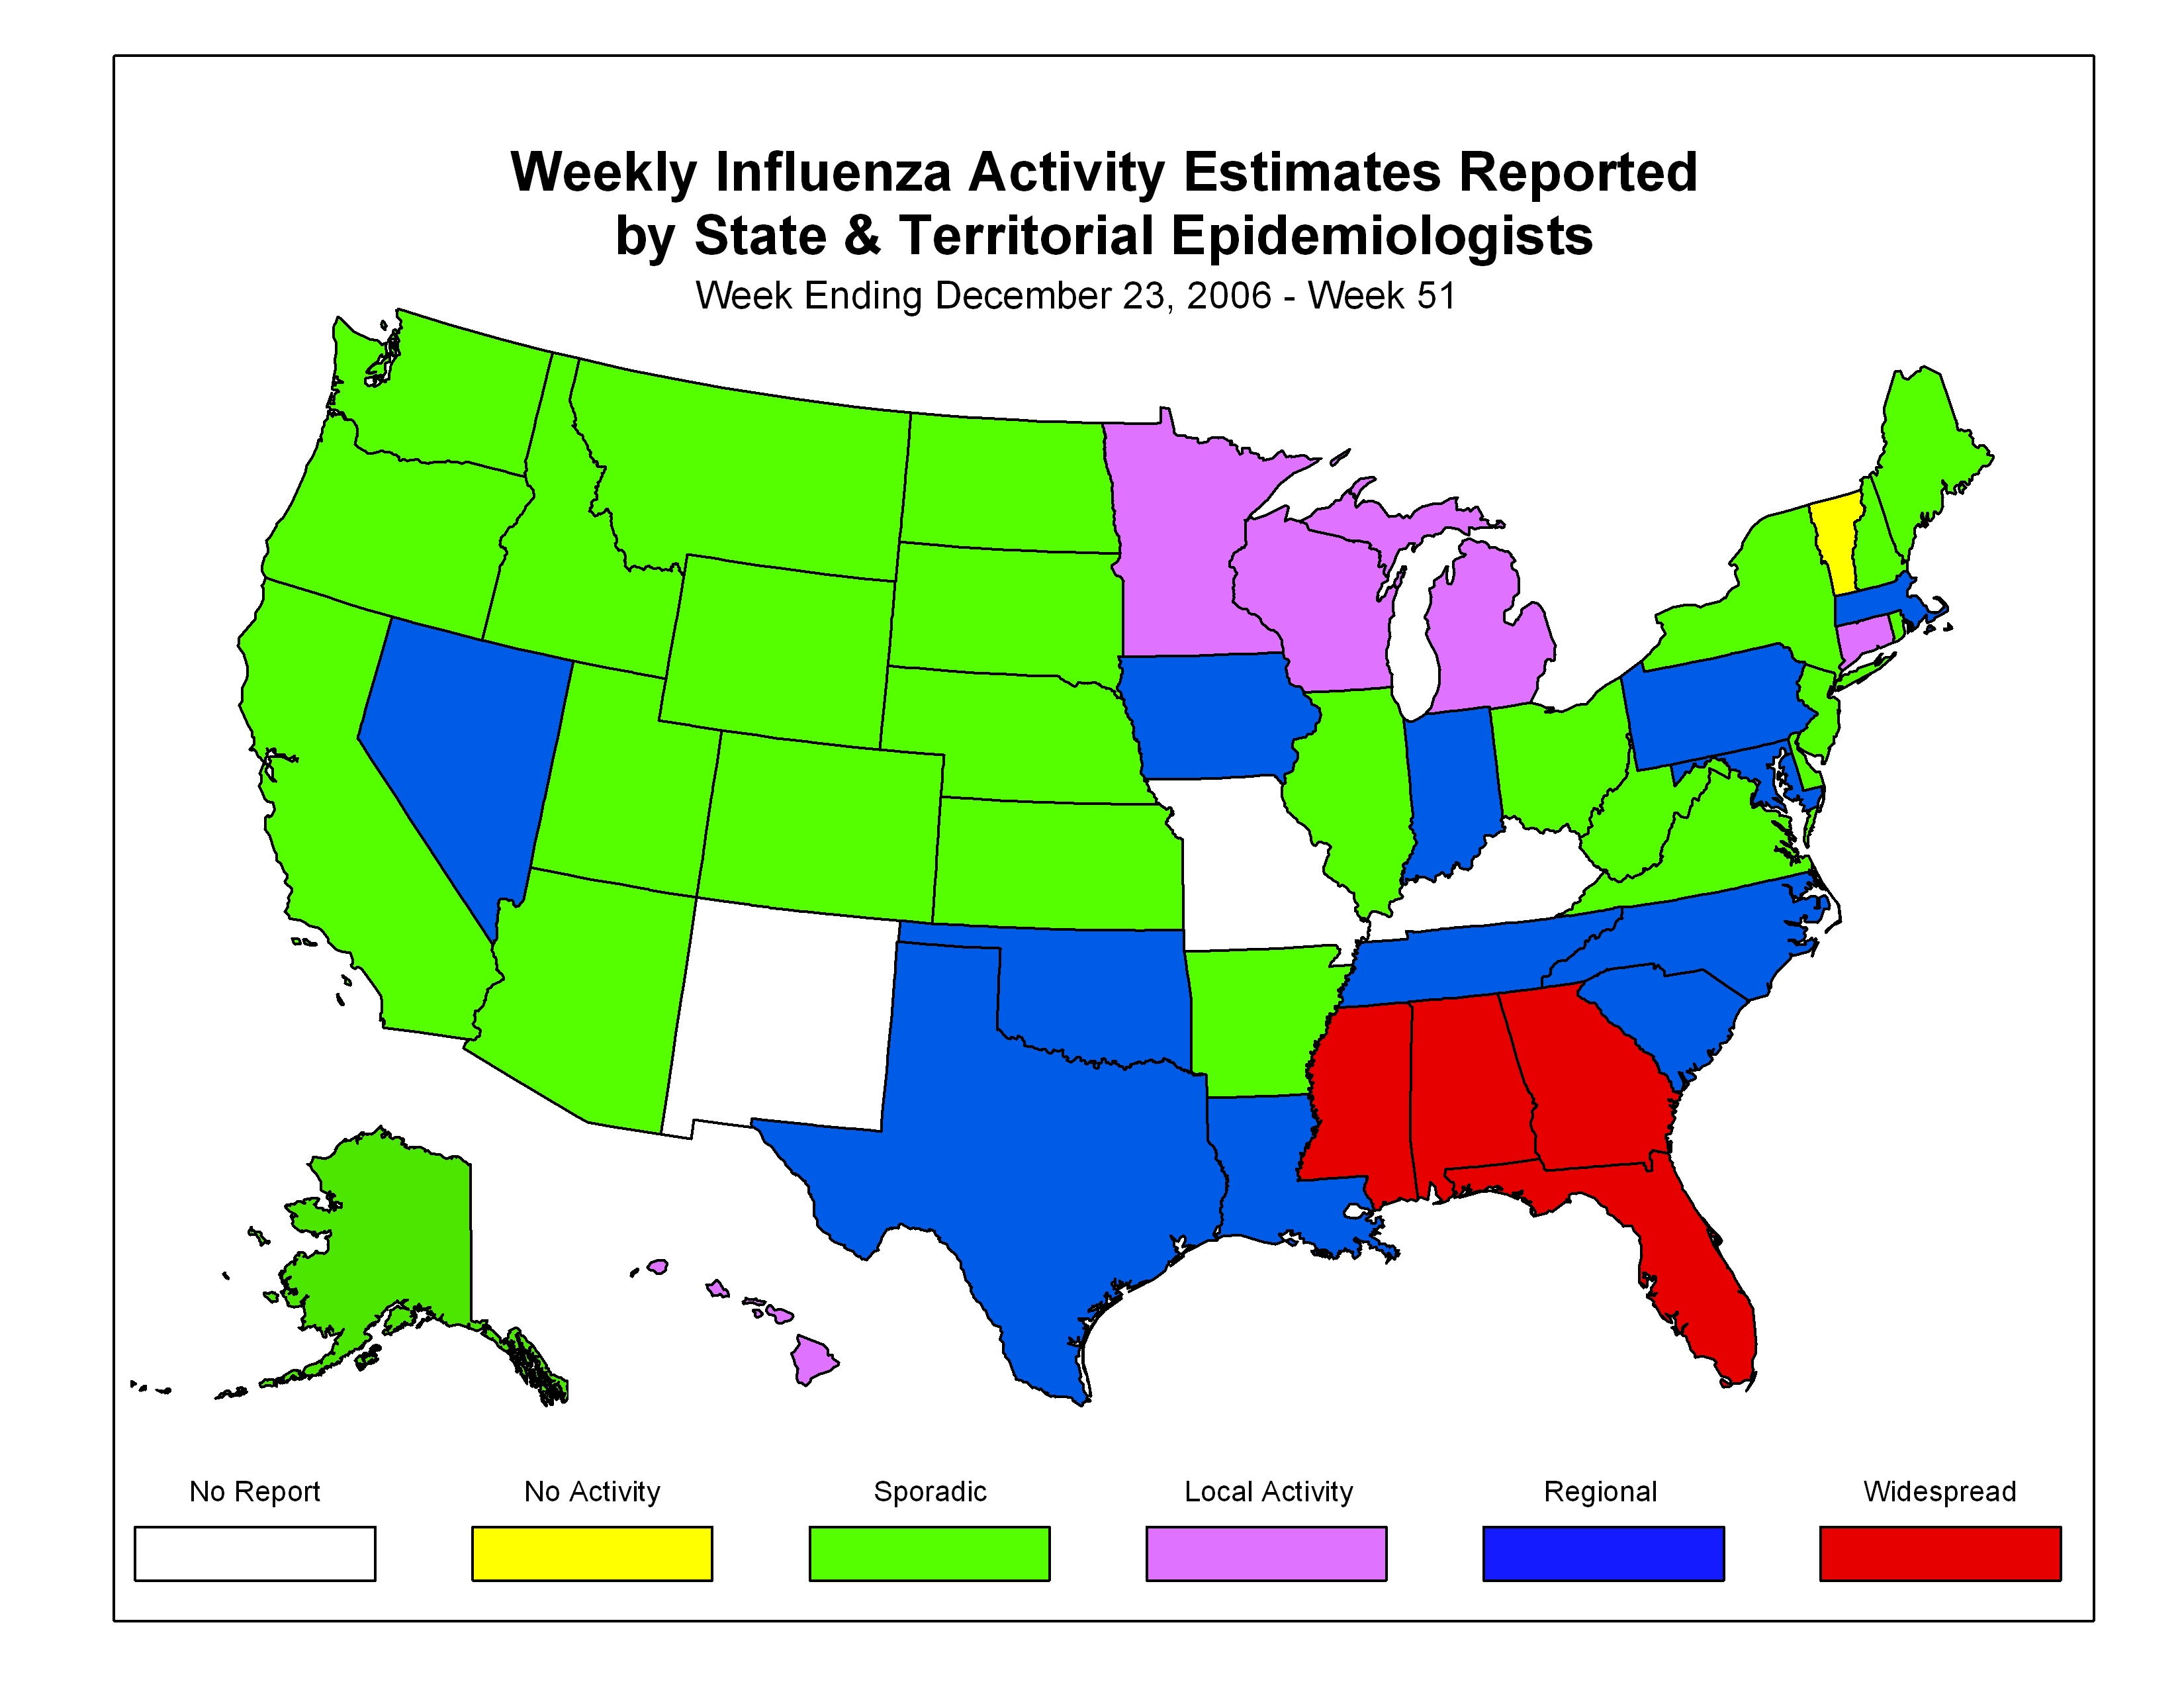
Influenza Activity as Assessed by State and Territorial Epidemiologists*:
During week 51, the following influenza activity was reported:
?Widespread activity was reported by four states (Alabama, Florida, Georgia, and Mississippi).
?Regional activity was reported by twelve states (Indiana, Iowa, Louisiana, Maryland, Massachusetts, Nevada, North Carolina, Oklahoma, Pennsylvania, South Carolina, Tennessee, and Texas).
?Local activity was reported by the District of Columbia and five states (Connecticut, Hawaii, Michigan, Minnesota, and Wisconsin).
?Sporadic activity was reported by New York City and 25 states (Alaska, Arizona, Arkansas, California, Colorado, Delaware, Idaho, Illinois, Kansas, Maine, Montana, Nebraska, New Hampshire, New Jersey, New York, North Dakota, Ohio, Oregon, Rhode Island, South Dakota, Utah, Virginia, Washington, West Virginia, and Wyoming).
?No influenza activity was reported by one state (Vermont).
?Three states did not report (Kentucky, Missouri, and New Mexico).
--------------------------------------------------------------------------------
Report prepared December 29, 2006
Error processing SSI file