Error processing SSI file
Error processing SSI file
Weekly Report: Influenza Summary Update
Week ending October 14, 2006—Week 41
Error processing SSI fileSynopsis:
During week 41 (October 8 – October 14, 2006)*, a low level of influenza activity was reported in the United States. Nine (1.0%) specimens tested by U.S. World Health Organization (WHO) and National Respiratory and Enteric Virus Surveillance System (NREVSS) collaborating laboratories were positive for influenza. The proportion of patient visits to sentinel providers for influenza-like illness (ILI) and the proportion of deaths attributed to pneumonia and influenza were below baseline levels. Two states reported local influenza activity; six states reported sporadic influenza activity; 40 states, New York City, and the District of Columbia reported no influenza activity, and 2 states did not report.
Laboratory Surveillance*:
During week 41, WHO and NREVSS laboratories reported 904 specimens tested for influenza viruses, nine of which were positive: six influenza A (H1) viruses and three influenza B viruses.
View Chart Data | View Full Screen
Pneumonia and Influenza Mortality Surveillance:
During week 41, 5.60% of all deaths were reported as due to pneumonia or influenza. This percentage is below the epidemic threshold of 6.38% for week 41.
Influenza-Associated Pediatric Mortality:
No influenza- associated pediatric deaths were reported for week 41.
Influenza-Associated Pediatric Hospitalizations
Laboratory-confirmed influenza-associated pediatric hospitalizations are monitored in two population-based surveillance networks†: the Emerging Infections Program (EIP) and the New Vaccine Surveillance Network (NVSN). EIP estimated rates of hospitalization for influenza will be reported every 2 weeks beginning October 27, 2006. NVSN estimated rates of hospitalization for influenza will be reported every 2 weeks, beginning December 2006.
Influenza-like Illness Surveillance*:
During week 41, 1.2%*** of patient visits to U.S. sentinel providers were due to ILI. This percentage is less than the national baseline**** of 2.1%. On a regional level**, the percentage of visits for ILI ranged from 0.3% to 2.0% with no regions above their region-specific baseline****.
View
Chart Data | View Full Screen
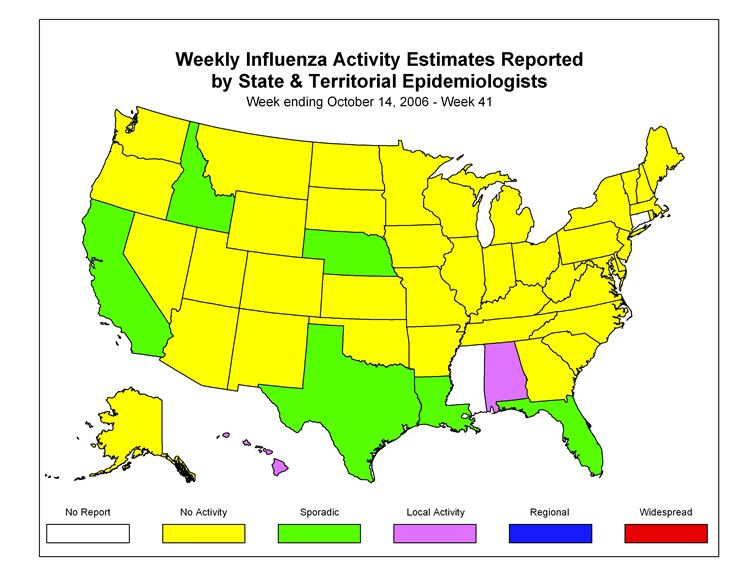
Influenza Activity as Assessed by State and Territorial Epidemiologists*:
Influenza activity was reported as local in two states (Alabama and Hawaii) and sporadic in six states (California, Florida, Idaho, Louisiana, Nebraska, and Texas). Forty states, New York City, and the District of Columbia reported no influenza activity, and two states and Puerto Rico did not report.
Report prepared October 20, 2006 Error processing SSI file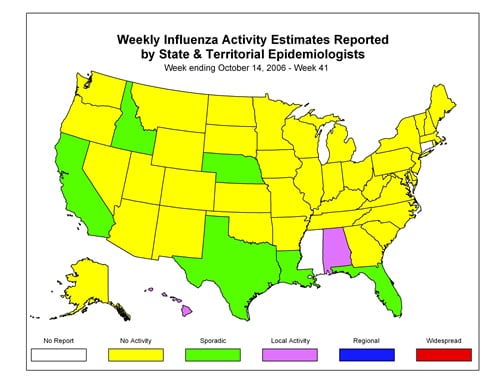