Error processing SSI file
Error processing SSI file
Weekly Report: Influenza Summary Update
Week ending October 7, 2006—Week 40
Background:
The Centers for Disease Control and Prevention (CDC) collects surveillance data year-round and reports on U.S. influenza activity each week during October through May. The U.S. influenza surveillance system consists of seven separate components: laboratory-based viral surveillance reported through the U.S. World Health Organization (WHO) Collaborating laboratories and National Respiratory and Enteric Virus Surveillance System (NREVSS) laboratories, mortality surveillance as reported through the 122 Cities Mortality Reporting System, influenza-associated pediatric mortality as reported through the Nationally Notifiable Disease Surveillance System, influenza-associated pediatric hospitalizations as reported through the Emerging Infections Programs in 10 sites and the New Vaccine Surveillance Network in 3 sites, sentinel provider surveillance for influenza-like illness (ILI), and state and territorial epidemiologist reports of influenza activity.
These surveillance components enable CDC to determine when and where influenza activity is occurring, determine what types of influenza viruses are circulating, detect changes in the influenza viruses collected and analyzed, track patterns of influenza-related illness, and assess the impact of influenza in the United States. All influenza reporting by states, laboratories, and health-care providers is voluntary.
Synopsis:
During week 40 (October 1 – October 7, 2006)*, a low level of influenza activity was reported in the United States. Three (0.4%) specimens tested by U.S. World Health Organization (WHO) and National Respiratory and Enteric Virus Surveillance System (NREVSS) collaborating laboratories were positive for influenza. The proportion of patient visits to sentinel providers for influenza-like illness (ILI) and the proportion of deaths attributed to pneumonia and influenza were below baseline levels. Two states reported local influenza activity; five states reported sporadic influenza activity; 41 states, New York City, and the District of Columbia reported no influenza activity and 2 states did not report.
Laboratory Surveillance*:
About 130 WHO and NREVSS collaborating laboratories located throughout the United States report the total number of respiratory specimens tested for influenza and the number positive for influenza types A and B each week. Some laboratories also report the influenza A virus subtypes isolated (H1 or H3) and the ages of the persons from whom the specimens were collected. A subset of the influenza viruses collected by laboratories are sent to CDC for further testing.
From week 21 through week 39 (weeks ending May 21 – September 30), WHO and NREVSS laboratories tested 20,909 specimens for influenza and 541 (2.6%) were positive. Of the positive results, 111 (20.5%) were influenza A (H1) viruses, 3 (0.6%) were influenza A (H3) viruses, 195 (36.0%) were influenza A viruses that were not subtyped, and 232 (42.9%) were influenza B viruses. More than half (56%) of these isolates were tested from mid-May through late June, when 4.0% of specimens tested were positive for influenza. Activity continued to decline through late August, when 1.4% of specimens tested were positive for influenza. Isolates were reported from all surveillance regions** during the summer.
Of the isolates identified from May 21 – September 30, CDC antigenically characterized 43 isolates including 4 influenza A (H3) viruses, 21 influenza A (H1) viruses, and 18 influenza B viruses. Of the 4 influenza A (H3) viruses, 2 were characterized as A/California/7/2004-like, and 2 were characterized as A/Wisconsin/67/2005-like, which is the influenza A (H3) component recommended for the 2006-07 vaccine. Of the 21 influenza A (H1) viruses, 17 were characterized as A/New Caledonia/20/99-like, which is the influenza A (H1) component recommended for the vaccine. Four (4) of the 17 viruses showed somewhat reduced titers to ferret antisera produced against A/New Caledonia/20/99.
Currently circulating influenza B viruses can be divided into two antigenically distinct lineages represented by B/Yamagata/16/88 and B/Victoria/2/87 viruses. The B component of the 2006-07 influenza vaccine belongs to the B/Victoria lineage. Of the 18 influenza B viruses identified during May 21 – September 30, all belonged to the B/Victoria lineage; 7 were characterized as B/Ohio/01/2005-like and 11 showed somewhat reduced titers to ferret antisera produced against B/Ohio/01/2005. B/Ohio/01/2005 is antigenically equivalent to B/Malaysia/2506-2004, the component recommended for the 2006-07 vaccine.
During week 40, WHO and NREVSS laboratories reported 813 specimens tested for influenza viruses, 3 of which were positive: one influenza A virus that was not subtyped (West North Central region) and two influenza B viruses (New England and West South Central regions).
Pneumonia and Influenza Mortality Surveillance:
Each week, the vital statistics offices of 122 cities report the total number of death certificates filed and the number of those for which pneumonia or influenza (P&I) is listed as the underlying or a contributing cause of death. The percentage of all deaths due to P&I are compared with baseline and epidemic threshold values calculated for each week.
During week 40, 6.26% of all deaths were reported as due to pneumonia or influenza. This percentage is below the epidemic threshold of 6.31% for week 40.
Influenza-Associated Pediatric Mortality:
Effective October 1, 2004, CDC added influenza-associated pediatric (i.e., persons younger than 18 years of age) mortality to the list of nationally notifiable diseases voluntarily reportable through the National Notifiable Diseases Surveillance System (NNDSS). This action is based on recommendations developed collaboratively by the Council of State and Territorial Epidemiologists (CSTE) and CDC, and approved at the 2004 CSTE annual meeting. The recommended methods for surveillance are described in the 2004 CSTE position statement for influenza-associated pediatric mortality (www.cste.org). No influenza- associated pediatric deaths were reported for week 40.
Influenza-Associated Pediatric Hospitalizations
Laboratory-confirmed influenza-associated pediatric hospitalizations are monitored in two population-based surveillance networks†: the Emerging Infections Program (EIP) and the New Vaccine Surveillance Network (NVSN). EIP estimated rates of hospitalization for influenza will be reported every 2 weeks beginning October 27, 2006. NVSN estimated rates of hospitalization for influenza will be reported every 2 weeks, beginning December 2006.
Influenza-like Illness Surveillance*:
Each week, approximately 1,200 health-care providers around the country report the total number of patients seen and the number of those patients with influenza-like illness (ILI) by age group. For this system, ILI is defined as fever (temperature of >100°F) plus a cough and/or a sore throat, in the absence of a known cause other than influenza.
The percentage of patient visits to sentinel providers for ILI reported each week is weighted on the basis of state population. This percentage is compared each week with the national baseline of 2.1%. The baseline is the mean percentage of visits for ILI during non-influenza weeks for the previous 3 seasons plus 2 standard deviations. Non-influenza weeks are defined as weeks in which the percentage of specimens tested for influenza that are influenza positive is less than 10%.
During week 40, 1.3%*** of patient visits to U.S. sentinel providers were due to ILI. This percentage is less than the national baseline of 2.1%. On a regional level**, the percentage of visits for ILI ranged from 0.1% to 1.9%.
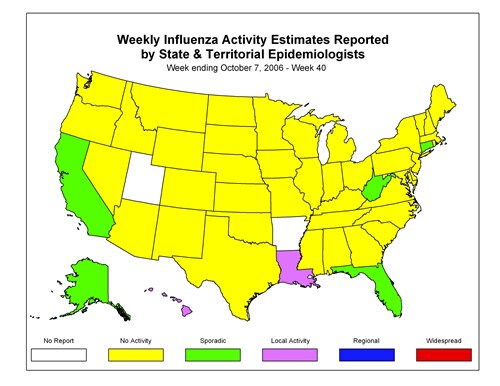
Influenza Activity as Assessed by State and Territorial Epidemiologists*:
State health departments report the estimated level of influenza activity in their states each week as no activity, sporadic, local, regional, or widespread. These levels are assigned based on data from ILI and virologic surveillance, as well as other state specific influenza surveillance systems.
Influenza activity was reported as local in two states (Hawaii and Louisiana) and sporadic in five states (Alaska, California, Connecticut, Florida, West Virginia) and Puerto Rico. Forty-one states, New York City, and the District of Columbia reported no influenza activity, and two states did not report.