Error processing SSI file
Error processing SSI file
Weekly Report: Influenza Summary Update
Week ending April 7, 2007-Week 14
Error processing SSI fileSynopsis:
During week 14 (April 1 ?7, 2007)*, influenza activity continued to decrease in the United States. Data from the U.S. World Health Organization (WHO) and National Respiratory and Enteric Virus Surveillance System (NREVSS) collaborating laboratories indicated a small increase in the percentage of specimens testing positive for influenza (10.9% of specimens tested positive for influenza during week 14 compared to 10.3% for week 13), although other surveillance systems indicated a decrease in influenza activity. ILI data decreased during week 14 and was below the national baseline. Eight states reported widespread influenza activity; five states reported regional influenza activity; 13 states and New York City reported local influenza activity; the District of Columbia and 22 states reported sporadic influenza activity; and two states reported no influenza activity. The number of jurisdictions reporting widespread or regional influenza activity decreased from 19 for week 13 to 13 for week 14. The percent of deaths due to pneumonia and influenza remained below baseline level.
Laboratory Surveillance*:
During week 14, WHO and NREVSS laboratories reported 2,063 specimens tested for influenza viruses, 225 (10.9%) of which were positive: three influenza A (H1) viruses, 21 influenza A (H3) viruses, 128 influenza A viruses that were not subtyped, and 73 influenza B viruses.
Since October 1, 2006, WHO and NREVSS laboratories have tested a total of 152,147 specimens for influenza viruses and 20,477 (13.4%) were positive. Among the 20,477 influenza viruses, 16,330 (79.7%) were influenza A viruses and 4,147 (20.3%) were influenza B viruses. Four thousand eight hundred three (29.4%) of the 16,330 influenza A viruses have been subtyped: 3,563 (74.2%) were influenza A (H1) viruses and 1,240 (25.8%) were influenza A (H3) viruses. Among specimens tested for influenza during the most recent three weeks (March 18 ?April 7, 2007), on a regional basis, the percent of specimens testing positive for influenza were as follows:
March 18 – April 7, 2007 (specimens testing positive) |
||
< 10% positive |
10-20% positive |
> 20% positive |
West South Central (8.3%) |
New England (13.4%) |
East North Central (24.4%) |
Pacific (6.4%) |
Mid Atlantic (13.7%) |
|
|
West North Central (13.7%) |
|
|
South Atlantic (13.1%) |
|
|
East South Central (19.5%) |
|
|
Mountain (13.3%) |
|
Although influenza A (H1) viruses have predominated overall in the United States this season, the predominant virus has varied by region during the past three weeks. Influenza A has predominated in all except the East South Central region, where 92.0% of all viruses reported from March 18 – April 7, 2007 were influenza B. Within the eight regions where influenza A predominated, A (H3) viruses accounted for more than 50% of the subtyped influenza A viruses in six regions (New England, East North Central, Mid-Atlantic, Mountain, Pacific, and West North Central regions) while A (H1) viruses predominated in the other two regions (South Atlantic and West South Central regions)
View
Chart Data |
View
Full Screen
Composition of the 2006-07 Influenza Vaccine:
WHO has recommended that the 2007-08 trivalent influenza vaccine for the Northern Hemisphere contain A/Solomon Islands/3/2006-like (H1N1), A/Wisconsin/67/2005-like (H3N2), and B/Malaysia/2506/2004-like viruses. The influenza A (H1N1) component has been changed from the 2006-07 season vaccine components. A/Solomon Islands/3/2006 is a recent antigenic variant of the current vaccine strain A/New Caledonia/20/99. The influenza A (H3N2) and influenza B components remain the same. B/Ohio/1/2005 is antigenically equivalent to B/Malaysia/2506/2004. This recommendation was based on antigenic analyses of recently isolated influenza viruses, epidemiologic data, and post-vaccination serologic studies in humans.
Antigenic Characterization:
CDC has antigenically characterized 492 influenza viruses [296 influenza A (H1), 44 influenza A (H3) viruses, and 152 influenza B viruses] collected by U.S. laboratories since October 1, 2006.
Influenza A (H1) [296]Influenza A (H3) [44]?Two hundred seventy-six (93%) of the 296 viruses characterized were similar to A/New Caledonia/20/99-like, which is the influenza A (H1) component of the 2006-07 influenza vaccine.
?Twenty (7%) of the 296 viruses showed somewhat reduced titers with antisera produced against A/New Caledonia/20/99 and are similar to A/Solomon Islands/3/2006-like. A/Solomon Islands/3/2006 is a recent antigenic variant of A/New Caledonia/20/99.
Influenza B (B/Victoria/02/87 and B/Yamagata/16/88 lineages) [152]?Twenty (45%) of the 44 viruses were characterized as A/Wisconsin/67/2005-like, which is the influenza A (H3) component of the 2006-07 influenza vaccine.
?Twenty-four (55%) of the 44 viruses showed somewhat reduced titers with antisera produced against A/Wisconsin/67/2005.
Victoria lineage [113]
?One hundred and thirteen (74%) of the 152 influenza B viruses characterized belong to the B/Victoria lineage of viruses.Yamagata lineage [39]o Seventy-two (64%) of these 113 viruses were similar to B/Ohio/01/2005, the B component of the 2006-07 influenza vaccine.
o Forty-one (36%) of these 113 viruses showed somewhat reduced titers with antisera produced against B/Ohio/01/2005.
?Thirty-nine (26%) of the 152 influenza B viruses characterized belong to the B/Yamagata lineage of viruses.
Pneumonia and Influenza (P&I) Mortality Surveillance*:
During week 14, 6.9% of all deaths were reported as due to pneumonia or influenza. This percentage is below the epidemic threshold of 7.7% for week 14.
Influenza-Associated Pediatric Mortality*:
One influenza-associated pediatric death was reported during week 14. Since October 1, 2006, CDC has received 41 reports of influenza-associated pediatric deaths that occurred during the current season.
Influenza-Associated Pediatric Hospitalizations*:
Laboratory-confirmed influenza-associated pediatric hospitalizations are monitored in two population-based surveillance networks?/sup>: the Emerging Infections Program (EIP) and the New Vaccine Surveillance Network (NVSN).
During November 5, 2006 to March 31, 2007, the preliminary laboratory-confirmed influenza-associated hospitalization rate for children 0-4 years old in the NVSN was 2.69 per 10,000.
During October 1, 2006 to March 31, 2007, the preliminary laboratory-confirmed influenza-associated hospitalization rate reported by the EIP for children 0?7 years old was 0.61 per 10,000. For children aged 0-4 years and 5-17 years, the rate was 1.54 per 10,000 and 0.21 per 10,000, respectively.
Influenza-like Illness Surveillance*:
During week 14, 1.4%** of patient visits to U.S. sentinel providers were due to ILI. This percentage is below the national baseline*** of 2.1%.
Two out of nine surveillance regions**** reported ILI above their region-specific baseline***:
Region |
Reported ILI (%) |
Region-Specific Baseline (%) |
New England |
1.7 |
1.2 |
Mid Atlantic |
1.3 |
2.6 |
East North Central |
1.1 |
1.9 |
West North Central |
0.7 |
1.5 |
South Atlantic |
1.3 |
2.3 |
East South Central |
0.7 |
2.4 |
West South Central |
3.1 |
3.0 |
Mountain |
1.3 |
1.7 |
Pacific |
1.3 |
3.2 |
View
Chart Data
| View Full Screen
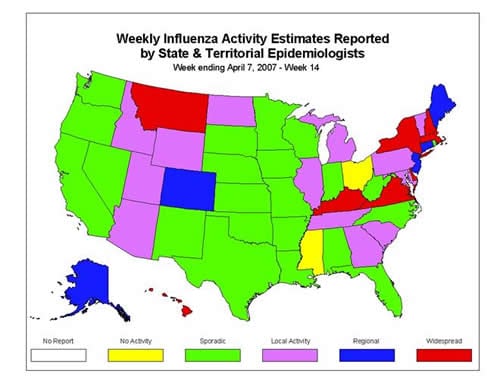
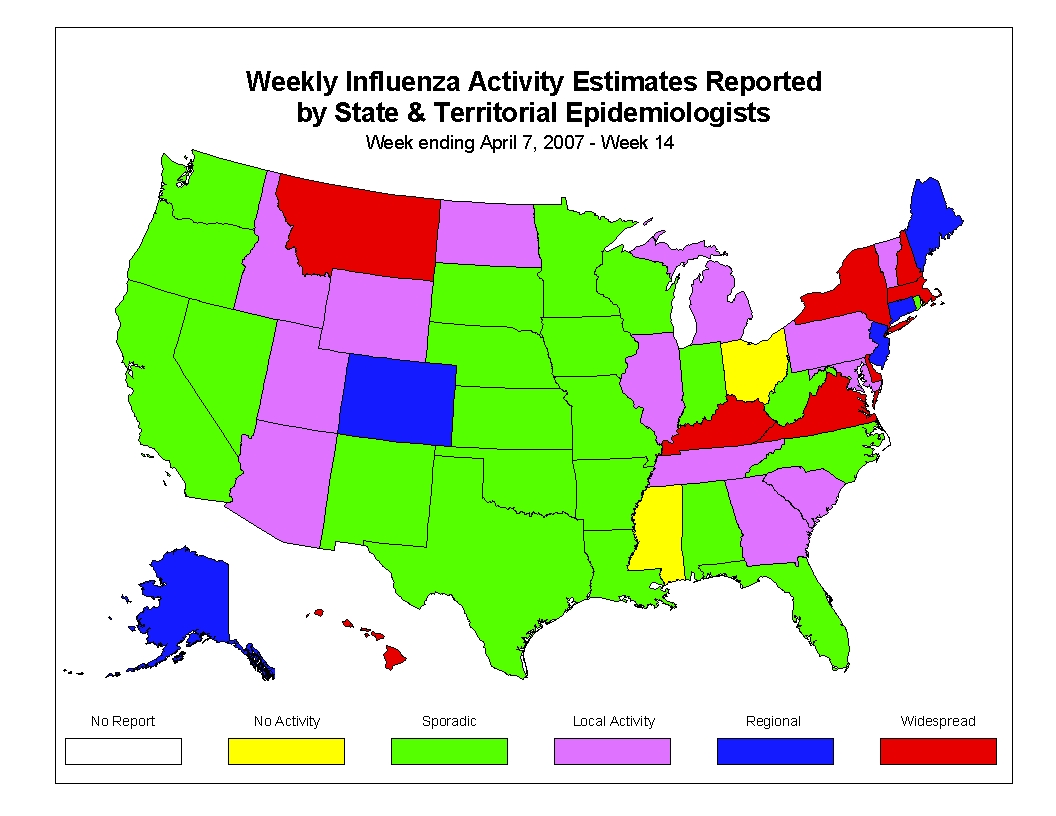
Influenza Activity as Assessed by State and Territorial Epidemiologists*:
During week 14, the following influenza activity was reported:
?Widespread activity was reported by eight states (Delaware, Hawaii, Kentucky, Massachusetts, Montana, New Hampshire, New York, and Virginia).
?Regional activity was reported by five states (Alaska, Colorado, Connecticut, Maine, and New Jersey).
?Local activity was reported by New York City and 13 states (Arizona, Georgia, Idaho, Illinois, Maryland, Michigan, North Dakota, Pennsylvania, South Carolina, Tennessee, Utah, Vermont, and Wyoming).
?Sporadic activity was reported by the District of Columbia and 22 states (Alabama, Arkansas, California, Florida, Indiana, Iowa, Kansas, Louisiana, Minnesota, Missouri, Nebraska, Nevada, New Mexico, North Carolina, Oklahoma, Oregon, Rhode Island, South Dakota, Texas, Washington, West Virginia, and Wisconsin).
?Mississippi and Ohio reported no influenza activity.
--------------------------------------------------------------------------------
Report prepared April 13, 2007 Error processing SSI file