Error processing SSI file
Error processing SSI file
Weekly Report: Influenza Summary Update
Week ending January 13, 2007-Week 2
Error processing SSI fileSynopsis:
During week 2 (January 7 ?January 13, 2007)*, laboratory surveillance data indicated a slight increase in influenza activity in the United States from week 1 to week 2. Among specimens tested by U.S. World Health Organization (WHO) and National Respiratory and Enteric Virus Surveillance System (NREVSS) collaborating laboratories for influenza, 8.6% were positive. The proportion of visits for influenza-like illness may have been influenced by changes in healthcare seeking patterns during the holiday season as has been seen in past seasons. ILI data was at baseline for week 2. Three states reported widespread influenza activity; 12 states reported regional influenza activity; 16 states reported local influenza activity; 18 states, the District of Columbia, and New York City reported sporadic influenza activity; and one state reported no influenza activity. The reporting of widespread or regional influenza activity decreased from 16 states for week 1 to 15 states for week 2. The percent of deaths due to pneumonia and influenza remained below baseline level.
Laboratory Surveillance*:
During week 2, WHO and NREVSS laboratories reported 3,070 specimens tested for influenza viruses, 265 (8.6%) of which were positive: 63 influenza A (H1) viruses, five influenza A (H3) virus, 149 influenza A viruses that were not subtyped, and 48 influenza B viruses.
Since October 1, 2006, WHO and NREVSS laboratories have tested a total of 58,701 specimens for influenza viruses and 3,237 (5.5%) were positive. Among the 3,237 influenza viruses, 2,608 (80.6%) were influenza A viruses and 629 (19.4%) were influenza B viruses. Eight hundred forty-one (30.8%) of the 2,608 influenza A viruses have been subtyped: 791 (94.1%) were influenza A (H1) viruses and 50 (5.9%) were influenza A (H3) viruses. Among specimens tested for influenza during the most recent three weeks (December 24, 2006 ?January 13, 2007), on a regional basis, the percent of specimens testing positive for influenza exceeded 10% in the East North Central (26.5%), West North Central (10.7%), South Atlantic (12.1%), and East South Central (28.6%) regions. The percent of specimens tested in the most recent three weeks testing positive for influenza was below 10% in the remaining five regions and ranged from 2.5% to 9.5%.
View
Chart Data |
View
Full Screen
Antigenic Characterization:
CDC has antigenically characterized 107 influenza viruses [59 influenza A (H1), two influenza A (H3) viruses, and 46 influenza B viruses] collected by U.S. laboratories since October 1, 2006.
Influenza A (H1) [59]?Fifty-three (90%) of the 59 viruses characterized were similar to A/New Caledonia/20/99-like, which is the influenza A (H1) component of the 2006-07 influenza vaccine.Influenza A (H3) [2]
?Six (10%) of the 59 viruses showed somewhat reduced titers with antisera produced against A/New Caledonia/20/99.?Both viruses were characterized as A/Wisconsin/67/2005-like, which is the influenza A (H3) component of the 2006-07 influenza vaccine.Influenza B (B/Victoria/02/87 and B/Yamagata/16/88 lineages) [46]Victoria lineage [31]
?Thirty-one (67%) of the 46 influenza B viruses characterized belong to the B/Victoria lineage of viruses.o Sixteen (52%) of these 31 viruses were similar to B/Ohio/01/2005, the B component of the 2006-07 influenza vaccine.Yamagata lineage [15]
o Fifteen (48%) of these 31 viruses showed somewhat reduced titers with antisera produced against B/Ohio/01/2005.
?Fifteen (33%) of the 46 influenza B viruses characterized belong to the B/Yamagata lineage of viruses.
Pneumonia and Influenza (P&I) Mortality Surveillance*:
During week 2, 6.9% of all deaths were reported as due to pneumonia or influenza. This percentage is below the epidemic threshold of 7.7% for week 2.
Influenza-Associated Pediatric Mortality*:
Four influenza-associated pediatric deaths were reported during week 2. Since October 1, 2006, CDC has received six reports of influenza-associated pediatric deaths that occurred during the current season.
Influenza-Associated Pediatric Hospitalizations*:
Laboratory-confirmed influenza-associated pediatric hospitalizations are monitored in two population-based surveillance networks?/sup>: the Emerging Infections Program (EIP) and the New Vaccine Surveillance Network (NVSN).
During November 5, 2006 ?January 6, 2007, the preliminary laboratory-confirmed influenza-associated hospitalization rate for children aged 0-4 years old in the NVSN was 0.5 per 10,000.
During October 1, 2006 ?January 6, 2007, the preliminary laboratory-confirmed influenza-associated hospitalization rate reported by the EIP for children 0?7 years old was 0.06 per 10,000. For children aged 0-4 years and 5-17 years, the rate was 0.14 per 10,000 and 0.03 per 10,000, respectively.
Influenza-like Illness Surveillance*:
During week 2, 2.1%*** of patient visits to U.S. sentinel providers were due to ILI. This percentage is at the national baseline**** of 2.1%. On a regional level**, the percentage of visits for ILI ranged from 1.0% to 3.6%.
Three out of nine surveillance regions reported ILI above their region-specific baseline****:
Region |
Reported ILI (%) |
Region-Specific Baseline (%) |
New England |
1.0 |
1.2 |
Mid Atlantic |
1.4 |
2.6 |
East North Central |
2.0 |
1.9 |
West North Central |
1.4 |
1.5 |
South Atlantic |
1.8 |
2.3 |
East South Central |
1.8 |
2.4 |
West South Central |
3.6 |
3.0 |
Mountain |
1.8 |
1.7 |
Pacific |
2.0 |
3.2 |
View
Chart Data
| View Full Screen
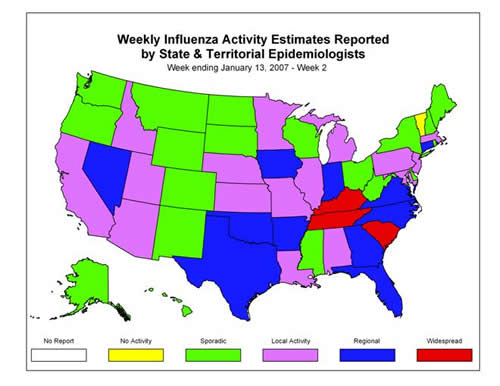
Influenza Activity as Assessed by State and Territorial Epidemiologists*:
During week 2, the following influenza activity was reported:
?Widespread activity was reported by three states (Kentucky, South Carolina, and Tennessee).
?Regional activity was reported by 12 states (Arkansas, Connecticut, Florida, Georgia, Indiana, Iowa, Nevada, North Carolina, Oklahoma, Pennsylvania, Texas, and Virginia).
?Local activity was reported by 16 states (Alabama, Arizona, California, Idaho, Illinois, Kansas, Louisiana, Maryland, Massachusetts, Michigan, Minnesota, Missouri, Nebraska, New Jersey, Utah, and Wisconsin).
?Sporadic activity was reported by the District of Columbia, New York City and 18 states (Alaska, Colorado, Delaware, Hawaii, Maine, Mississippi, Montana, New Hampshire, New Mexico, New York, North Dakota, Ohio, Oregon, Rhode Island, South Dakota, Washington, West Virginia, and Wyoming).
?No influenza activity was reported by one state (Vermont).
--------------------------------------------------------------------------------
Report prepared January 19, 2007
Error processing SSI file