Error processing SSI file
Error processing SSI file
Weekly Report: Influenza Summary Update
Week ending December 10, 2005-Week 49
Error processing SSI fileSynopsis:
During week 49 (December 4 ?December 10, 2005)*, influenza activity overall was low in the United States. Forty-one (3.0%) specimens tested by U.S. World Health Organization (WHO) and National Respiratory and Enteric Virus Surveillance System (NREVSS) collaborating laboratories were positive for influenza. The proportion of patient visits to sentinel providers for influenza-like illness (ILI) and the proportion of deaths attributed to pneumonia and influenza were below baseline levels. One state reported regional influenza activity; 5 states, and the District of Columbia reported local influenza activity; 30 states and New York City reported sporadic influenza activity; and 13 states reported no influenza activity.
Laboratory Surveillance*:
During week 49, WHO and NREVSS laboratories reported 1,387 specimens tested for influenza viruses and 41 (3.0%) were positive. Of these, 14 were influenza A (H3N2) viruses, 1 was an influenza A (H1N1) virus, 24 were influenza A viruses that were not subtyped, and 2 were influenza B viruses.
Since October 2, WHO and NREVSS laboratories have tested a total of 22,176 specimens for influenza viruses and 242 (1.1%) were positive. Among the 242 influenza viruses, 218 (90.1%) were influenza A viruses and 24 (9.9%) were influenza B viruses. One hundred twelve (51.4%) of the 218 influenza A viruses have been subtyped; 108 (96.4%) were influenza A (H3N2) viruses and 4 (3.6%) were influenza A (H1N1) viruses. Thirty states from all surveillance regions** have reported laboratory-confirmed influenza this season. One hundred four (43.0%) of the 242 isolates have been reported by the Pacific region and 58 (24.0%) were from the Mountain region.
Antigenic Characterization:
CDC has antigenically characterized 16 influenza viruses collected by U.S. laboratories since October 1, 2005: 14 influenza A (H3N2) virus and 2 influenza B viruses. The influenza A (H3N2) viruses were characterized as A/California/07/2004-like, which is the influenza A (H3N2) component recommended for the 2005-06 influenza vaccine. Influenza B viruses currently circulating can be divided into two antigenically distinct lineages represented by B/Yamagata/16/88 and B/Victoria/2/87 viruses. One of the influenza B viruses isolated belonged to the B/Yamagata lineage and was characterized as B/Florida/07/2004-like. This is a minor antigenic variant of B/Shanghai/361/2002, the recommended influenza B component for the 2005-06 influenza vaccine. The other influenza B virus was identified as belonging to the B/Victoria lineage.
Pneumonia and Influenza (P&I) Mortality Surveillance*:
During week 49, 6.4% of all deaths reported by the vital statistics offices of 122 U.S. cities were reported as due to pneumonia or influenza. This percentage is below the epidemic threshold of 7.6% for week 49.
Influenza-Associated Pediatric Mortality*:
Two influenza-associated pediatric deaths were reported for week 49. Since October 2, 2005, CDC has received reports of four influenza-associated pediatric deaths, two of which occurred during the 2004-05 influenza season.
Influenza-Associated Pediatric Hospitalizations*:
Laboratory-confirmed influenza-associated pediatric hospitalizations are monitored in two population-based surveillance networks? the Emerging Infections Program (EIP) and the New Vaccine Surveillance Network (NVSN). During October 1 ?November 26, 2005, the preliminary influenza-associated hospitalization rate for children 0? years old reported by the EIP was 0.06 per 10,000. The EIP also monitors hospitalizations in children 5-17 years old. There were no influenza-associated hospitalizations for this age group reported during this period. The overall hospitalization rate reported by the EIP for children aged 0-17 years was 0.02 per 10,000. During October 30 ?November 26, 2005, there were no laboratory-confirmed influenza-associated hospitalizations for children 0 ?4 years old in the NVSN. EIP and NVSN hospitalization rate estimates are preliminary and may change as data continue to be collected.
Influenza-like Illness Surveillance*:
During week 49, 1.8%*** of patient visits to U.S. sentinel providers were due to ILI. This percentage is less than the national baseline of 2.2%. On a regional level**, the percentage of visits for ILI ranged from 0.5% to 3.4%. Due to wide variability in regional level data, it is not appropriate to apply the national baseline to regional level data.
View
Chart Data
| View Full Screen
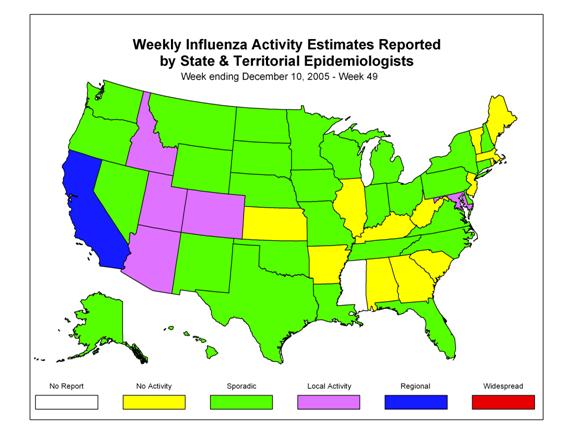
Influenza Activity as Assessed by State and Territorial Epidemiologists*:
During week 49, California reported regional influenza activity. Five states (Arizona, Colorado, Idaho, Maryland, and Utah) and the District of Columbia reported local influenza activity. Thirty states (Alaska, Connecticut, Delaware, Florida, Hawaii, Indiana, Iowa, Louisiana, Michigan, Minnesota, Missouri, Montana, Nebraska, Nevada, New Hampshire, New Mexico, New York, North Carolina, North Dakota, Ohio, Oklahoma, Oregon, Pennsylvania, South Dakota, Tennessee, Texas, Virginia, Washington, Wisconsin, and Wyoming) and New York City reported sporadic influenza activity. Thirteen states reported no influenza activity and one state did not report.
--------------------------------------------------------------------------------
Report prepared December 16, 2005
Error processing SSI file