Error processing SSI file
Error processing SSI file
Weekly Report: Influenza Summary Update
Week ending November 5, 2005-Week 44
Error processing SSI fileSynopsis:
During week 44 (October 30 ?November 5, 2005)*, influenza activity was low in the United States. Two (0.2%) specimens tested by U.S. World Health Organization (WHO) and National Respiratory and Enteric Virus Surveillance System (NREVSS) collaborating laboratories were positive for influenza. The proportion of patient visits to sentinel providers for influenza-like illness (ILI) and the proportion of deaths attributed to pneumonia and influenza were below baseline levels. Sixteen states, New York City, and Puerto Rico reported sporadic influenza activity, 34 states and the District of Columbia reported no influenza activity.
Laboratory Surveillance*:
During week 44, WHO and NREVSS laboratories reported 951 specimens tested for influenza viruses and 2 (0.2%) were positive. Of these, 1 was an influenza A virus that was not subtyped and 1 was an influenza B virus.
Since October 2, WHO and NREVSS laboratories have tested a total of 7,535 specimens for influenza viruses and 44 (0.6%) were positive. Among the 44 influenza viruses, 37 (84.1%) were influenza A viruses and 7 (15.9%) were influenza B viruses. Eighteen (48.6%) of the 37 influenza A viruses have been subtyped and all were influenza A (H3N2) viruses. Fourteen states from 6 of the 9 surveillance regions** have reported laboratory-confirmed influenza this season.
Antigenic Characterization:
CDC has antigenically characterized 2 influenza viruses collected by U.S. laboratories since October 1, 2005: 1 influenza A (H3N2) virus and 1 influenza B virus. The influenza A (H3N2) virus was characterized as A/California/07/2004-like, which is the influenza A (H3N2) component recommended for the 2005-06 influenza vaccine. The influenza B virus was identified as belonging to the B/Victoria/2/87 lineage. Influenza B viruses currently circulating can be divided into two antigenically distinct lineages represented by B/Yamagata/16/88 and B/Victoria/2/87 viruses; the recommended B component for the 2005-06 influenza vaccine is from the B/Yamagata lineage.
Pneumonia and Influenza (P&I) Mortality Surveillance*:
During week 44, 6.5% of all deaths reported by the vital statistics offices of 122 U.S. cities were reported as due to pneumonia or influenza. This percentage is below the epidemic threshold of 7.1% for week 44.
Influenza-Associated Pediatric Mortality*:
No influenza-associated pediatric deaths were reported for week 44.
Influenza-Associated Pediatric Hospitalizations*:
Laboratory-confirmed influenza-associated pediatric hospitalizations are monitored in two population-based surveillance networks? the Emerging Infections Program (EIP) and the New Vaccine Surveillance Network (NVSN). During October 1 ?October 29, 2005 there were no reported cases of laboratory-confirmed influenza-associated pediatric hospitalizations from the EIP. NVSNs estimated rates of hospitalization for influenza will be reported every 2 weeks beginning November 25, 2005.
In years 2000?005, the end-of-season hospitalization rate for NVSN ranged from 3.7 (2002-03) to 12 (2003-04) per 10,000 children. The 2003-04 end-of-season hospitalization rate for EIP was 8.9 per 10,000 children aged 0-4 years and 0.8 per 10,000 for children aged 5-17 years. The 2004-05 NVSN end-of-season hospitalization rate for children aged 0-4 years was 7 per 10,000. The preliminary 2004-05 end-of-season hospitalization rate for EIP was 3.3 per 10,000 children aged 0-4 years and 0.6 per 10,000 for children aged 5-17 years. The difference in rates between NVSN and EIP may be due to different case-finding methods and the different populations monitored. For a summary of the methods used in each system, please refer to the surveillance methods in the Flu Activity section of the CDC influenza website.
Influenza-like Illness Surveillance*:
During week 44, 1.6%*** of patient visits to U.S. sentinel providers were due to ILI. This percentage is less than the national baseline of 2.2%. On a regional level**, the percentage of visits for ILI ranged from 0.3% to 2.7%. Due to wide variability in regional level data, it is not appropriate to apply the national baseline to regional level data.
View
Chart Data
| View Full Screen
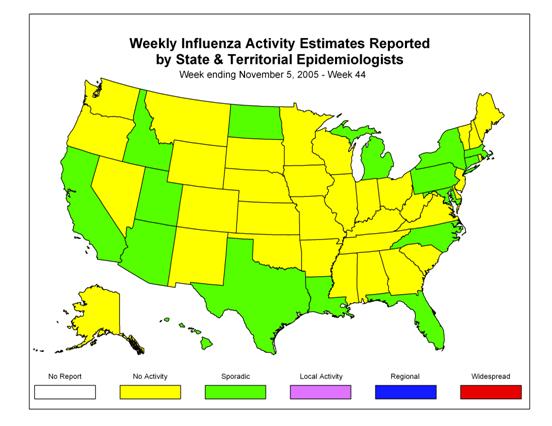
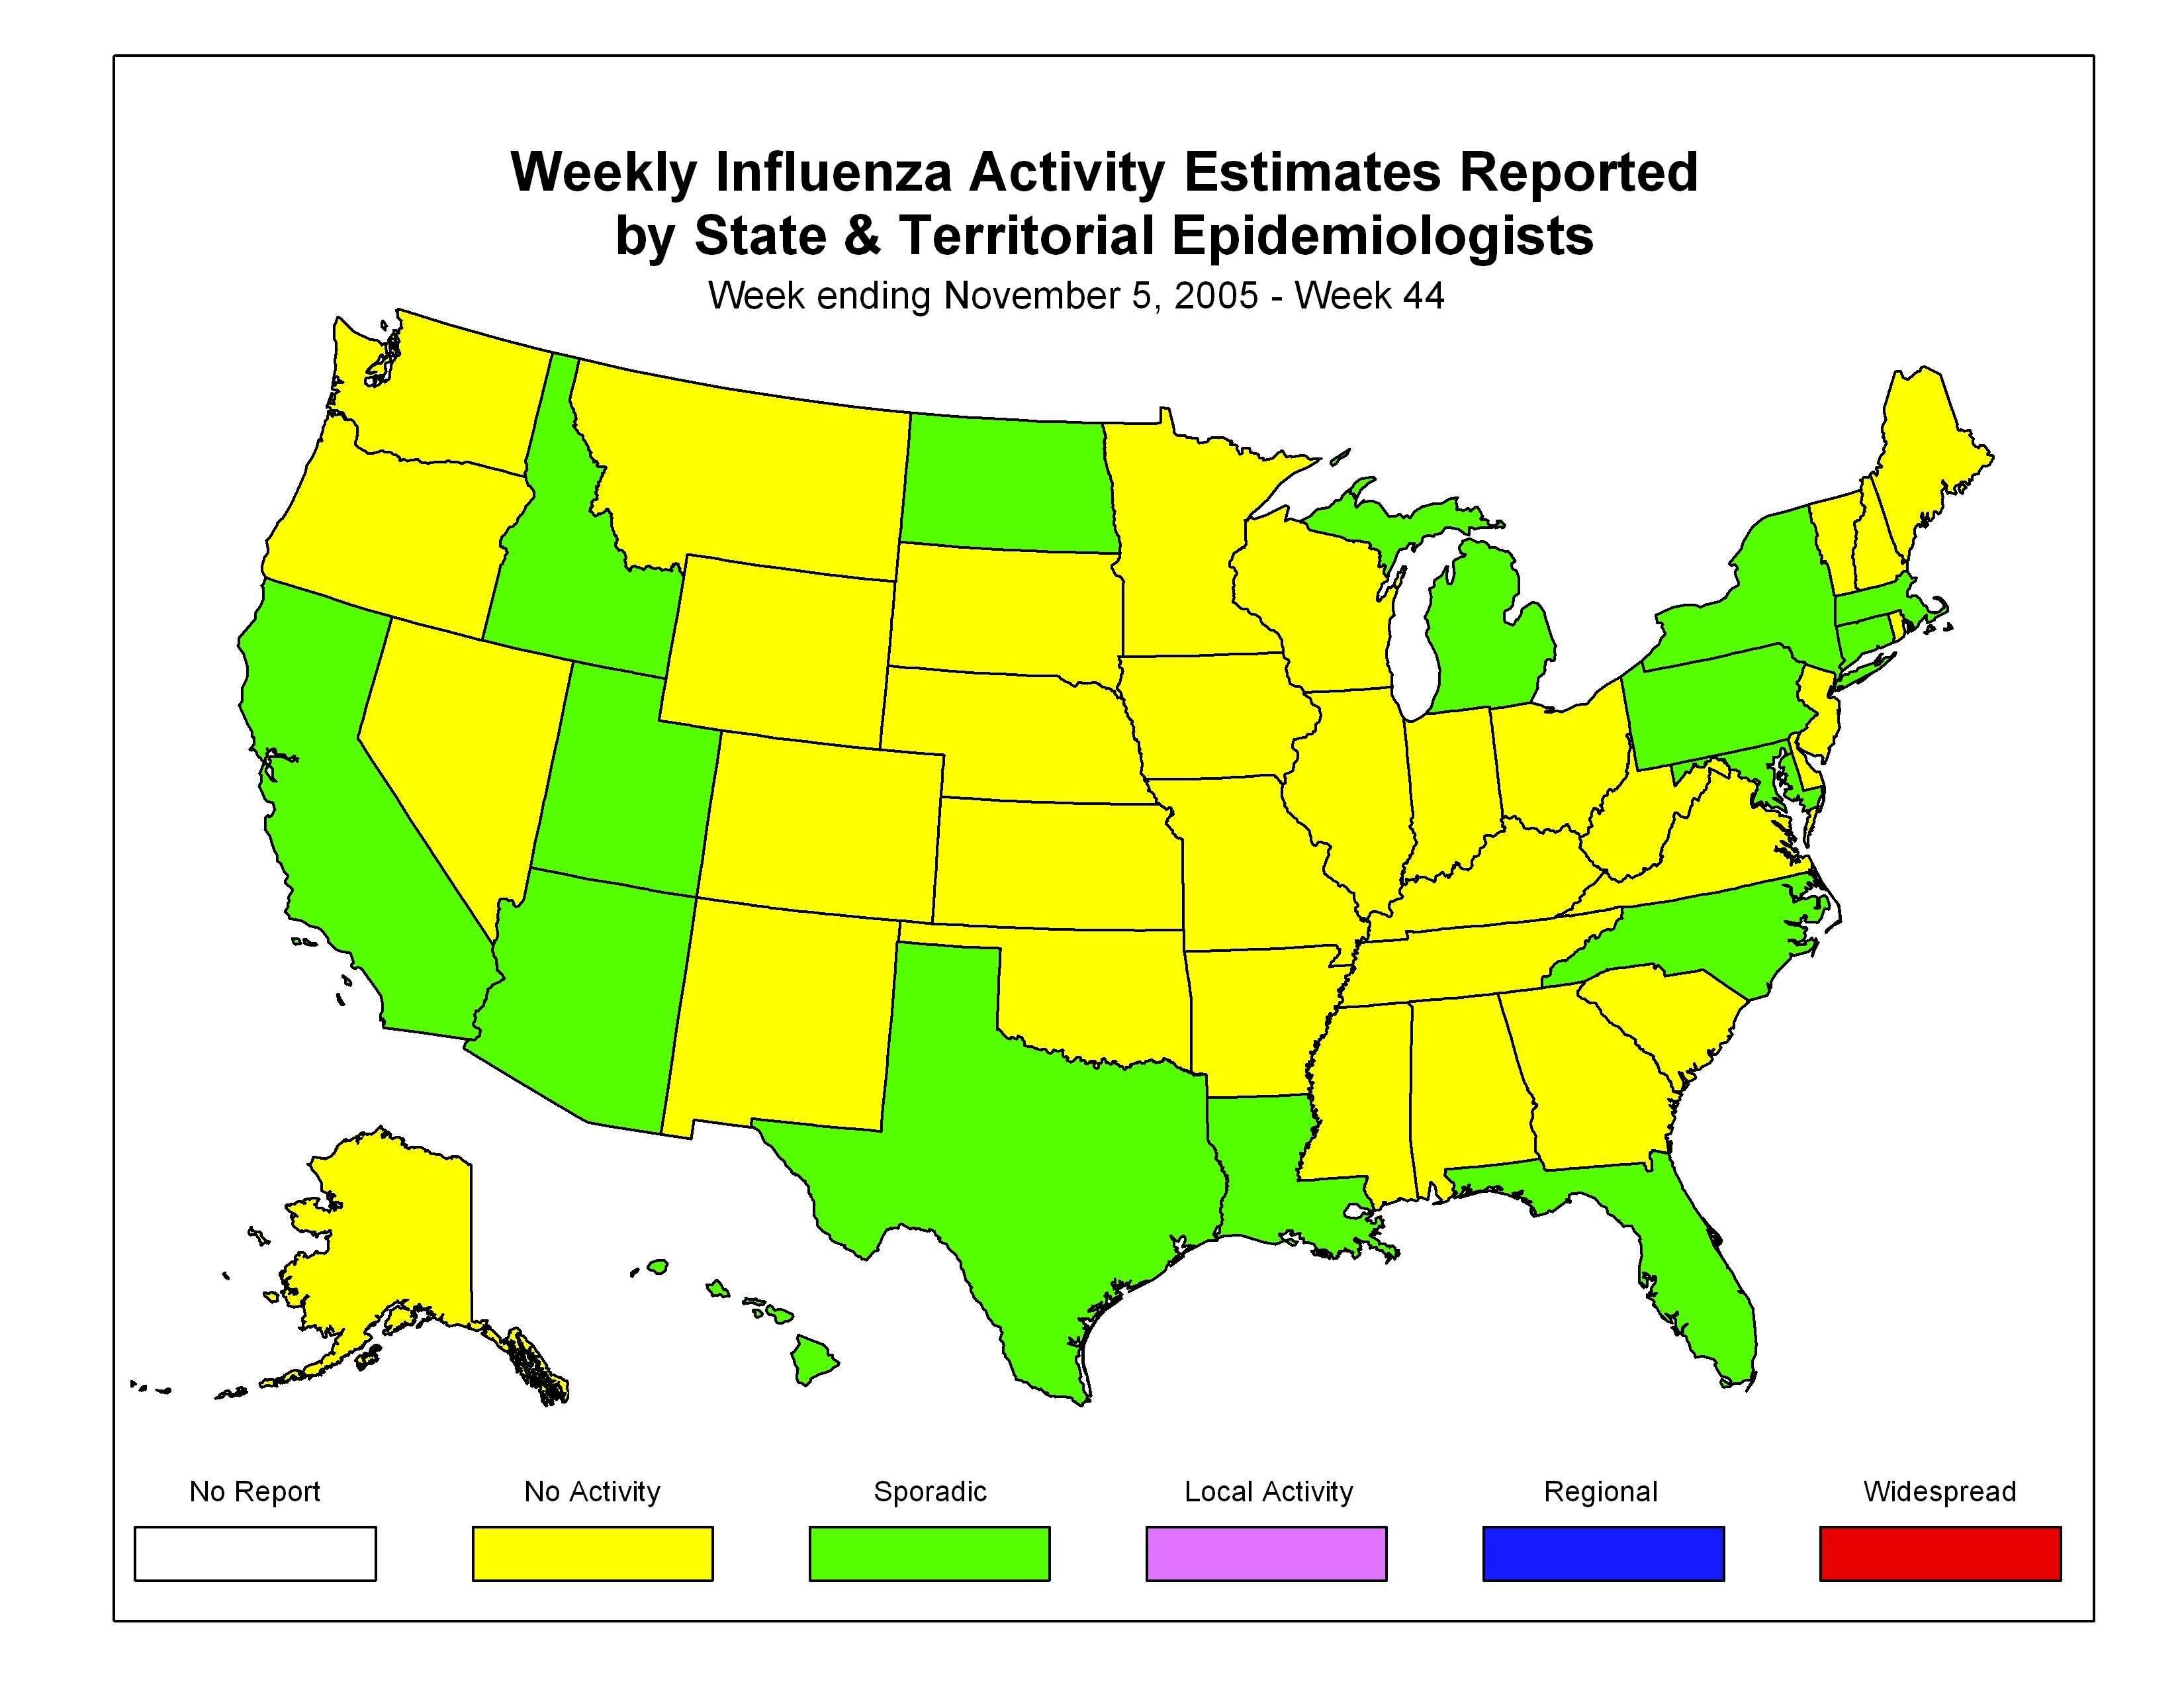
Influenza Activity as Assessed by State and Territorial Epidemiologists*:
During week 44, 16 states (Arizona, California, Connecticut, Florida, Hawaii, Idaho, Maryland, Massachusetts, Michigan, Louisiana, New York, North Carolina, North Dakota, Pennsylvania, Texas, and Utah), New York City, and Puerto Rico reported sporadic influenza activity. Thirty-four states and the District of Columbia reported no influenza activity.
--------------------------------------------------------------------------------
Report prepared November 10, 2005
Error processing SSI file