Error processing SSI file
Error processing SSI file
Weekly Report: Influenza Summary Update
Week ending November 20, 2004-Week 46
Error processing SSI fileThe following information may be quoted:
Synopsis:
During week 46 (November 14-20, 2004)*, influenza activity overall was low in the United States. Thirty-six (3.2%) specimens tested by U.S. World Health Organization (WHO) and National Respiratory and Enteric Virus Surveillance System (NREVSS) collaborating laboratories were positive for influenza. The proportion of patient visits to sentinel providers for influenza-like illness (ILI) and the proportion of deaths attributed to pneumonia and influenza were below national baseline values. However, in the Mid-Atlantic region there were increases in both the proportion of patient visits to sentinel providers for influenza-like illness (ILI) and percentage of laboratory specimens testing positive for influenza. Two states reported widespread activity, and 1 state and New York City reported regional activity. Thirty-one states and the District of Columbia reported sporadic influenza activity and 14 states reported no influenza activity.
As of week 46, no influenza-associated pediatric deaths have been reported to CDC.
Laboratory Surveillance*:
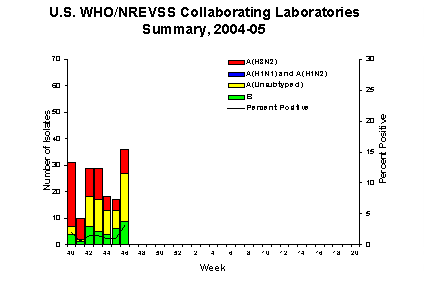
During week 46, WHO and NREVSS laboratories reported testing 1,118 specimens for influenza viruses, of which 36 (3.2%) were positive. Of these, 9 were influenza A (H3N2) viruses, 18 were influenza A viruses that were not subtyped, and 9 were influenza B viruses. The Mid-Atlantic region** reported testing 145 specimens, of which 22 (15.2%) were positive for influenza, an increase from 2.0% percent positive during the previous week.
Since October 3, WHO and NREVSS laboratories have tested a total of 11,899 specimens for influenza viruses and 170 (1.4%) were positive. Among the 170 influenza viruses, 134 (78.8%) were influenza A viruses and 36 (21.2%) were influenza B viruses. Seventy-three (54.5%) of the 134 influenza A viruses have been subtyped and all were influenza A (H3N2) viruses. Twenty-seven states from all surveillance regions** have reported laboratory-confirmed influenza this season.
Antigenic Characterization:
CDC has antigenically characterized 11 influenza viruses collected by U.S. laboratories since October 1, 2004: nine influenza A (H3N2) viruses and 2 influenza B viruses. All of the influenza A (H3N2) isolates were characterized as A/Fujian/411/2002-like (H3N2), which is the influenza A (H3N2) component recommended for the 2004-05 influenza vaccine. Both influenza B viruses characterized were B/Shanghai/361/2002-like, which is the influenza B component recommended for the 2004-05 influenza vaccine.
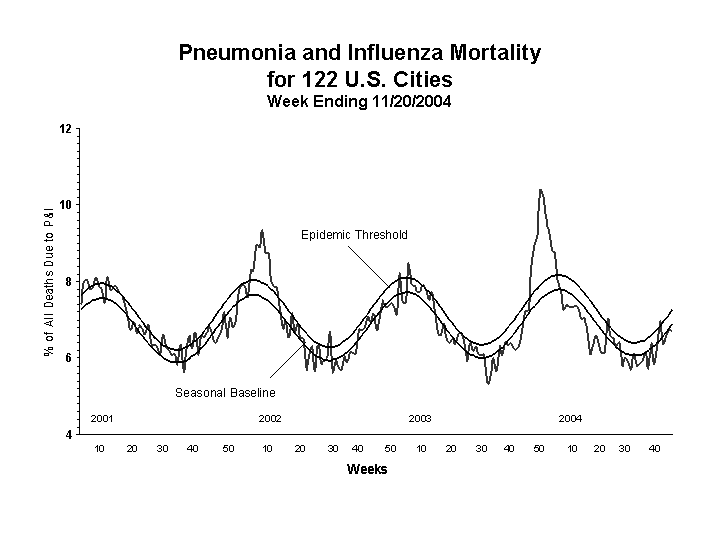
Pneumonia and Influenza (P&I) Mortality Surveillance*:
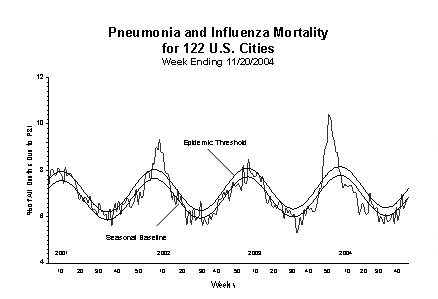
During week 46, 6.7% of all deaths reported by the vital statistics offices of 122 U.S. cities were reported as due to pneumonia or influenza. This percentage is below the epidemic threshold of 7.2% for week 46.
As of week 46, no influenza-associated pediatric deaths have been reported to CDC.
Influenza-Associated Pediatric Mortality*:
As of week 46, no influenza-associated pediatric deaths have been reported to CDC.
Influenza-Associated Pediatric Hospitalizations:
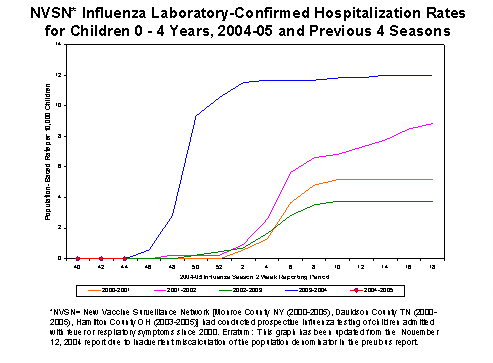
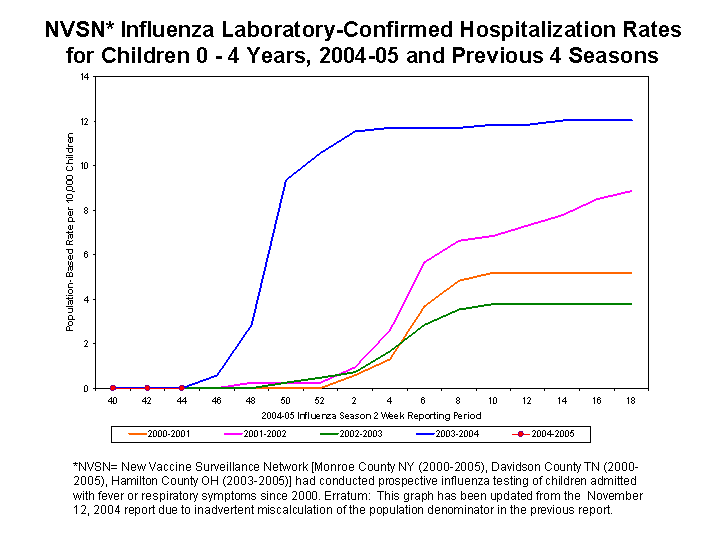
The New Vaccine Surveillance Network consists of three sites in Cincinnati OH, Nashville TN, and Rochester NY. The sites conduct population-based surveillance for laboratory-confirmed influenza among children 0-4 years of age who are admitted to the hospital with fever or acute respiratory illnesses. During October 3-November 13, 2004, there were no laboratory-confirmed influenza-associated hospitalizations for children 0-4 years old. In years 2000-2003, the end-of-season hospitalization rate ranged from 3.7 to 12 per 10,000 children. Hospitalization rate estimates are preliminary and may change as data continue to be collected.
The Emerging Infections Program (EIP) is collecting data in 9 sites on hospitalizations of children <18 years of age with illnesses associated with laboratory-confirmed influenza. Hospitalization data from the EIP sites will be included as they become available.
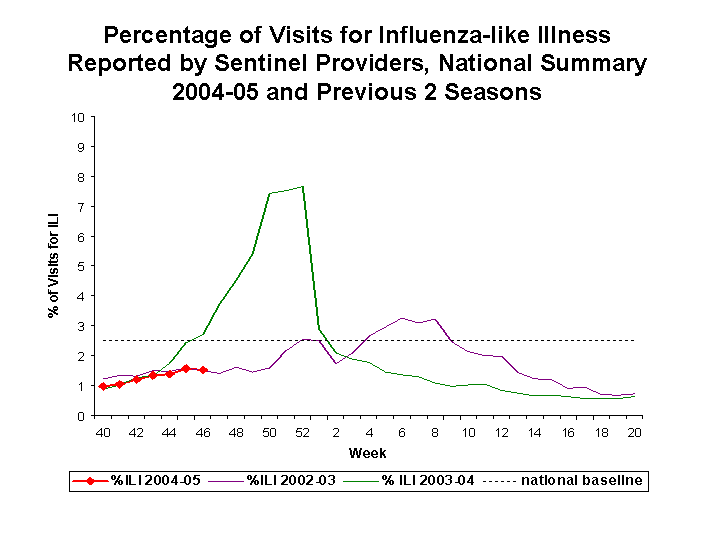
Influenza-like Illness Surveillance*:
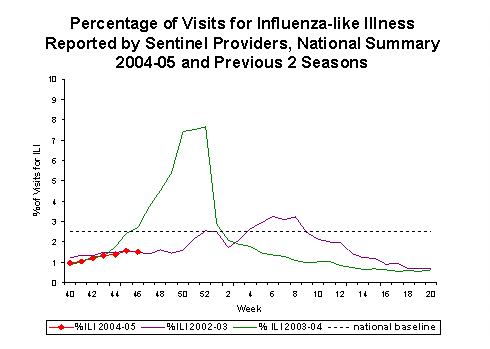
During week 46, 1.5%*** of patient visits to U.S. sentinel providers were due to ILI. This percentage is less than the national baseline of 2.5%. On a regional level**, the percentage of visits for ILI ranged from 0.7% in the New England region to 2.5% in the Mid-Atlantic region. The percentage of visits for ILI in the Mid-Atlantic region increased from 1.6% reported last week. Due to wide variability in regional level data, it is not appropriate to apply the national baseline to regional level data.
View
Chart Data
| View Full Screen
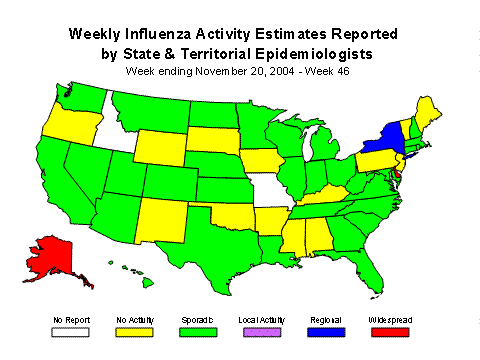
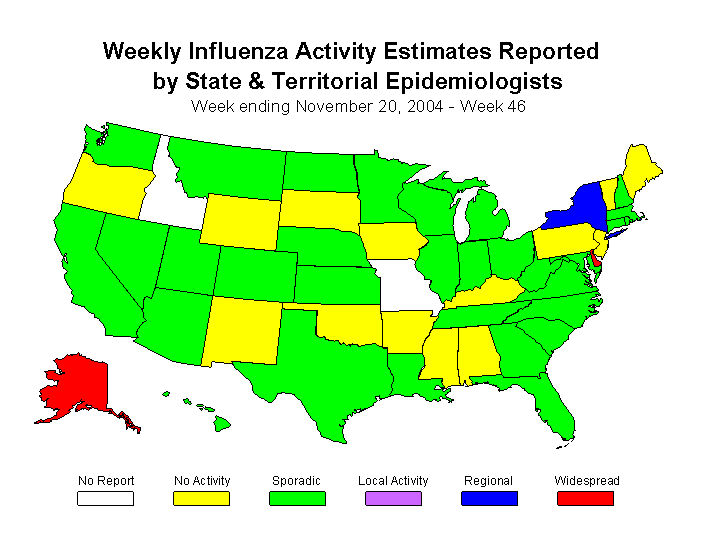
Influenza Activity as Assessed by State and Territorial Epidemiologists*:
During week 46, Alaska and Delaware reported widespread activity, and New York and New York City reported regional activity. Thirty-one states (Arizona, California, Colorado, Connecticut, Florida, Georgia, Hawaii, Illinois, Indiana, Kansas, Louisiana, Maryland, Massachusetts, Michigan, Minnesota, Montana, Nebraska, Nevada, New Hampshire, North Carolina, North Dakota, Ohio, Rhode Island, South Carolina, Tennessee, Texas, Utah, Virginia, Washington, West Virginia, and Wisconsin) and the District of Columbia reported sporadic influenza activity. Fourteen states reported no influenza activity and 2 states did not report.
--------------------------------------------------------------------------------
* Reporting is incomplete for this week. Numbers may change as more reports are received.
** Surveillance Regions: New England (Connecticut, Maine, Massachusetts, New Hampshire, Vermont, Rhode Island); Mid-Atlantic (New Jersey, New York City, Pennsylvania, Upstate New York); East North Central (Illinois, Indiana, Michigan, Ohio, Wisconsin); West North Central (Iowa, Kansas, Minnesota, Missouri, Nebraska, North Dakota, South Dakota); South Atlantic (Delaware, Florida, Georgia, Maryland, North Carolina, South Carolina, Virginia, Washington, D.C., West Virginia); East South Central (Alabama, Kentucky, Mississippi, Tennessee); West South Central (Arkansas, Louisiana, Oklahoma, Texas); Mountain (Arizona, Colorado, Idaho, Montana, Nevada, New Mexico, Utah, Wyoming); Pacific (Alaska, California, Hawaii, Oregon, Washington)
*** The national and regional percentage of patient visits for ILI is weighted on the basis of state population.
Report prepared: November 24, 2004
Error processing SSI file