Error processing SSI file
Error processing SSI file
Weekly Report: Influenza Summary Update
Week ending January 3, 2004-Week 53
Error processing SSI fileThe following information may be quoted:
Synopsis:
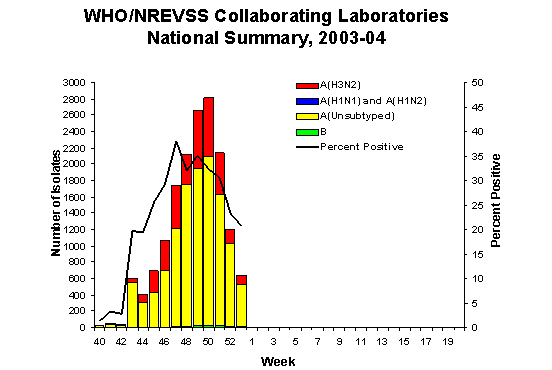
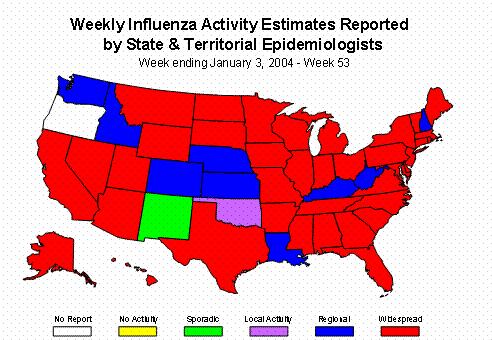
The number of states reporting widespread influenza activity decreased during week 53 (December 28, 2003 - January 3, 2004), the percentage of specimens testing positive for influenza also decreased, and the percentage of patient visits for influenza-like illness (ILI) decreased in all 9 surveillance regions with an overall national percentage of 6.2%. However, pneumonia and influenza (P & I) mortality (9.4%) continued to exceed the epidemic threshold for week 53 (8.0%). Six hundred forty-one (20.7%) of 3,092 specimens collected from throughout the United States and tested by U.S. World Health Organization (WHO) and National Respiratory and Enteric Virus Surveillance System (NREVSS) collaborating laboratories were positive for influenza. Thirty-eight state health departments, the District of Columbia, and New York City reported widespread influenza activity, 9 states reported regional activity, 1 state reported local activity, 1 state reported sporadic activity, and 1 state did not report.
Laboratory Surveillance*:
During week 53, WHO and NREVSS laboratories reported 3,092 specimens tested for influenza viruses, and 641 (20.7%) were positive. Of these, 111 were influenza A(H3N2) viruses, 524 were influenza A viruses that were not subtyped, and 6 were influenza B viruses.
Since September 28, WHO and NREVSS laboratories have tested a total of 57,831 specimens for influenza viruses and 16,174 (28.0%) were positive. Among the 16,174 influenza viruses, 16,065 (99.3%) were influenza A viruses and 109 (0.7%) were influenza B viruses. Three thousand nine hundred twenty-seven (24.4%) of the 16,065 influenza A viruses have been subtyped; 3,926 (99.9%) were influenza A (H3N2) viruses and 1 (0.1%) was an A (H1) virus.

Antigenic Characterization:
CDC has antigenically characterized 461 influenza viruses collected by U.S. laboratories since October 1: two influenza A (H1) viruses, 454 influenza A (H3N2) viruses, and five influenza B viruses. The hemagglutinin proteins of the influenza A (H1) viruses were similar antigenically to the hemagglutinin of the vaccine strain A/New Caledonia/20/99. Of the 454 influenza A (H3N2) isolates that have been characterized, 98 (21.6%) were similar antigenically to the vaccine strain A/Panama/2007/99 (H3N2), and 356 (78.4%) were similar to the drift variant, A/Fujian/411/2002 (H3N2). Four influenza B viruses characterized were similar antigenically to B/Sichuan/379/99 and 1 was similar antigenically to B/Hong Kong/330/2001.
Pneumonia and Influenza (P&I) Mortality Surveillance:
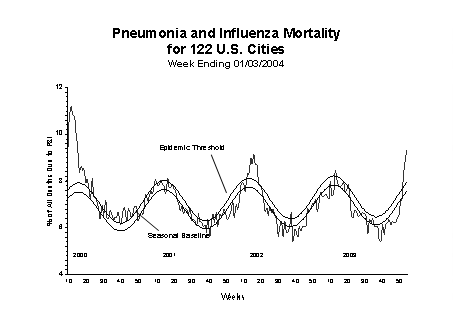
During week 53, 9.4% of all deaths reported by the vital statistics offices of 122 U.S. cities were due to pneumonia and influenza. This percentage is above the epidemic threshold of 8.0% for week 53.

Influenza-like Illness Surveillance *:
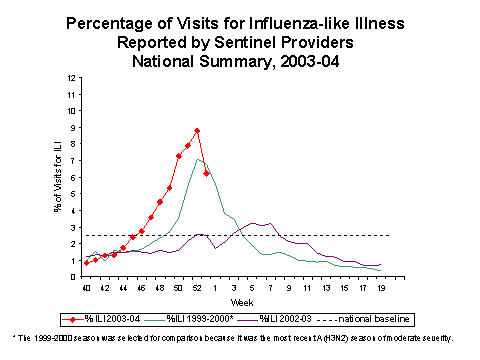
During week 53, 6.2%** of patient visits to U.S. sentinel providers were due to ILI. This percentage is above the national baseline of 2.5%. The percentage of patient visits for ILI decreased in all 9 surveillance regions. On a regional level***, the percentage of visits for ILI was highest in the West South Central region (8.3%), followed by the Pacific region (7.1%), East North Central region (6.8%), South Atlantic region (6.4%), Mid-Atlantic region (6.2%), East South Central region (4.8%), New England region (4.6%), West North Central region (4.5%), and the Mountain region (3.4%). Due to wide variability in regional level data, it is not appropriate to apply the national baseline to regional level data.

View
Chart Data
| View Full Screen
Influenza Activity as Assessed by State and Territorial Epidemiologists**:
Influenza activity was reported as widespread in 38 states (Alabama, Alaska, Arizona, Arkansas, California, Connecticut, Delaware, Florida, Georgia, Hawaii, Illinois, Indiana, Iowa, Maine, Maryland, Massachusetts, Michigan, Minnesota, Mississippi, Missouri, Montana, Nevada, New Jersey, New York, North Carolina, North Dakota, Ohio, Pennsylvania, Rhode Island, South Carolina, South Dakota, Tennessee, Texas, Utah, Vermont, Virginia, Wisconsin, and Wyoming), the District of Columbia, and New York City. Regional activity was reported in 9 states (Colorado, Idaho, Kansas, Kentucky, Louisiana, Nebraska, New Hampshire, Washington, and West Virginia). Oklahoma reported local activity, and New Mexico and Guam reported sporadic activity. Oregon did not report.
* Reporting is incomplete for this week. Numbers may change as more reports are received.
** The national and regional percentage of patient visits for ILI is weighted on the basis of state population.
*** Surveillance Regions: New England (Connecticut, Maine, Massachusetts, New Hampshire, Vermont, Rhode Island); Mid-Atlantic (New Jersey, New York City, Pennsylvania, Upstate New York); East North Central (Illinois, Indiana, Michigan, Ohio, Wisconsin); West North Central (Iowa, Kansas, Minnesota, Missouri, Nebraska, North Dakota, South Dakota); South Atlantic (Delaware, Florida, Georgia, Maryland, North Carolina, South Carolina, Virginia, Washington, D.C., West Virginia); East South Central (Alabama, Kentucky, Mississippi, Tennessee); West South Central (Arkansas, Louisiana, Oklahoma, Texas); Mountain (Arizona, Colorado, Idaho, Montana, Nevada, New Mexico, Utah, Wyoming); Pacific (Alaska, California, Hawaii, Oregon, Washington)
Report prepared January 7, 2004
Error processing SSI file