Error processing SSI file
Error processing SSI file
Weekly Report: Influenza Summary Update
Week ending December 14, 2002-Week 50
Error processing SSI fileThe following information may be quoted:
Synopsis:
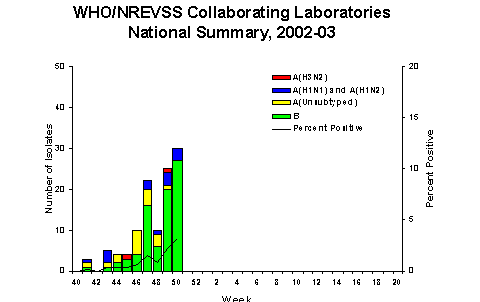
During week 50 (December 8-14, 2002)*, 30 (3.2%) of the specimens tested by World Health Organization (WHO) laboratories were positive for influenza. The proportion of patient visits to sentinel providers for influenza-like illness (ILI) overall was 1.3%, which is less than the national baseline of 1.9%. The proportion of deaths attributed to pneumonia and influenza was 6.6%. One state and territorial health department reported widespread influenza activity, 3 reported regional activity, 23 reported sporadic activity, and 23 reported no influenza activity**.
Laboratory Surveillance*:
During week 50, WHO laboratories
reported 929 specimens tested for influenza viruses, of
which 30 (3.2%) were positive. Three influenza A (H1)?viruses
and 27 influenza B viruses were identified. Data from the
National Respiratory and Enteric Virus Surveillance System
(NREVSS) laboratories for week 50 were not available at
the time this report was written; therefore, numbers may
change substantially next week.
Since September 29, WHO and NREVSS laboratories have tested
a total of 15,429 specimens for influenza viruses and 113
(0.7%) were positive. Of the 113 viruses identified, 33
(29%) were influenza A viruses and 80 (71%) were influenza
B viruses. Fifteen (45%) of the 33 influenza A viruses
have been subtyped; 13 were influenza A (H1)?viruses and
2 were influenza A (H3N2) viruses. Seventeen states have
reported laboratory-confirmed influenza. Influenza A viruses
have been identified in California, Florida, Hawaii, Louisiana,
Massachusetts, Nebraska, New York, North Carolina, Oregon,
South Carolina, Texas, Virginia, Washington, and Wisconsin.
Influenza B viruses have been identified in Arkansas, Arizona,
California, Louisiana, New York, North Carolina, Oklahoma, South Carolina,
and Texas. Of the 113 viruses reported, 70 (62%) were identified in the West
South Central region*** and 31 (27%) were identified in the South Atlantic
region***.

Antigenic Characterization of Viral Isolates:
CDC has antigenically characterized 24 influenza viruses submitted by U.S. laboratories since September 29: seventeen influenza B viruses, two influenza A (H3N2) viruses, and 5 influenza A (H1)?viruses. Four of the influenza A (H1) viruses contained the N1 neuraminidase and one contained the N2 neuraminidase. The influenza B viruses, the A (H3N2) viruses, and the hemagglutinin protein of the A (H1) viruses were similar antigenically to the corresponding vaccine strains B/Hong Kong/330/01, A/Panama/2007/99 (H3N2), and A/New Caledonia/20/99 (H1N1), respectively.
Click here for more information about influenza A (H1N2) viruses
Pneumonia and Influenza (P&I) Mortality Surveillance:
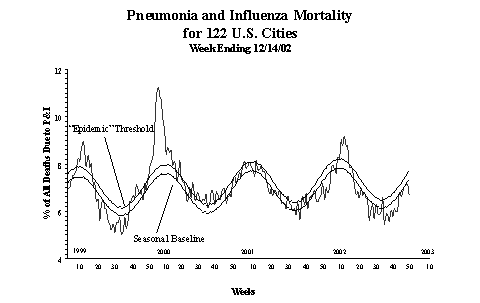
During
week 50, the percentage of all deaths due to pneumonia and
influenza as reported by the vital statistics offices of
122 U.S. cities was 6.6%. This percentage is below the epidemic
threshold of 7.7% for week 50.

Influenza-like Illness Surveillance *:
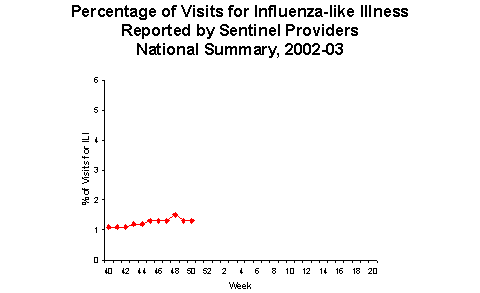
During week 50, 1.3% of patient visits to U.S. sentinel providers were due to ILI. This percentage is less than the national baseline of 1.9%. On a regional level***, the percentage of visits for ILI ranged from 0.5% to 2.3%. Due to wide variability in regional level data, it is not appropriate to apply the national baseline to regional level data.

Influenza Activity as Assessed by State and Territorial Epidemiologists**:
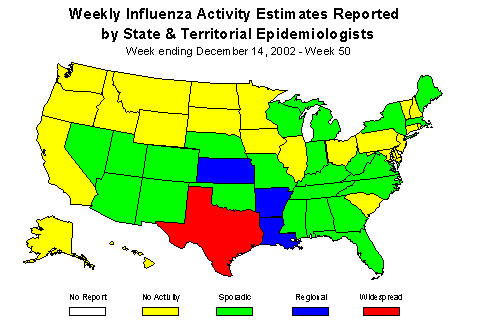
Influenza activity was reported as widespread in Texas and regional in 3 states (Arkansas, Kansas, and Louisiana). Twenty-three states and New York City reported sporadic influenza activity, and 23 states reported no influenza activity.

* Reporting is incomplete for this week. Numbers may change
as more reports are received.
** Influenza activity is defined as influenza-like illness and/or culture-confirmed
influenza.
咺ncludes both the A (H1N1) and A (H1N2) influenza virus subtypes. The influenza
A (H1N2) strain appears to have resulted from the reassortment of the genes of
currently circulating influenza A (H1N1) and A (H3N2) subtypes. Because the hemagglutinin
proteins of the A (H1N2) viruses are similar to those of the currently circulating
A (H1N1) viruses and the neuraminidase proteins are similar to those of the currently
circulating A (H3N2) viruses, the 2002-03 influenza vaccine should provide protection
against A (H1N2) viruses.
*** Surveillance Regions: New England (Connecticut, Maine,
Massachusetts, New Hampshire, Vermont, Rhode Island); Mid-Atlantic (New
Jersey, New York City, Pennsylvania, Upstate New York); East North
Central (Illinois, Indiana, Michigan, Ohio, Wisconsin); West
North Central (Iowa, Kansas, Minnesota, Missouri, Nebraska, North
Dakota, South Dakota); South Atlantic (Delaware, Florida,
Georgia, Maryland, North Carolina, South Carolina, Virginia, Washington, D.C.,
West Virginia); East South Central (Alabama, Kentucky, Mississippi,
Tennessee); West South Central (Arkansas, Louisiana, Oklahoma,
Texas); Mountain (Arizona, Colorado, Idaho, Montana, Nevada,
New Mexico, Utah, Wyoming); Pacific (Alaska, California, Hawaii,
Oregon, Washington)
Report prepared December 18, 2002
Error processing SSI file