Error processing SSI file
Error processing SSI file
Weekly Report: Influenza Summary Update
Week ending March 15, 2003-Week 11
Error processing SSI fileThe following information may be quoted:
Synopsis:
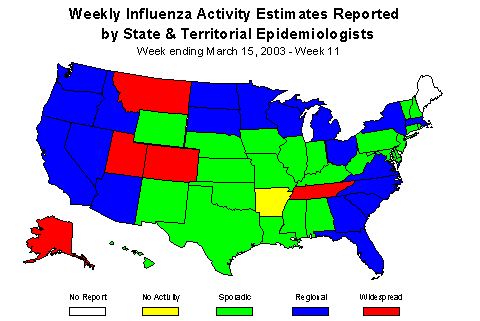
During week 11 (March 9-15, 2003)*, 221 (14.5%) of the specimens tested by U.S. World Health Organization (WHO) and National Respiratory and Enteric Virus Surveillance System (NREVSS) collaborating laboratories were positive for influenza. The proportion of patient visits to sentinel providers for influenza-like illness (ILI) overall was 2.0%, which is above the national baseline of 1.9%. The proportion of deaths attributed to pneumonia and influenza was 7.8%. Five state and territorial health departments reported widespread influenza activity, 19 reported regional activity, 24 reported sporadic activity, and 1 reported no influenza activity**.
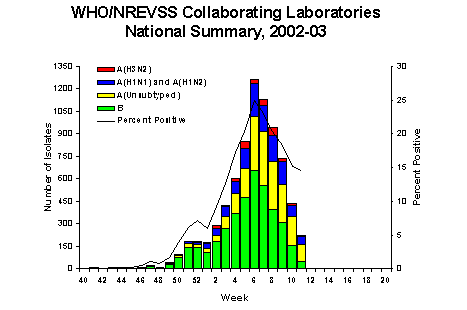
Laboratory Surveillance*:
During week 11, U.S. WHO and NREVSS laboratories reported 1,528 specimens tested for influenza viruses, of which 221 (14.5%) were positive. Fifty-five influenza A (H1)?viruses, 3 influenza A (H3N2) viruses, 111 unsubtyped influenza A viruses, and 52 influenza B viruses were identified. During the past 3 weeks (weeks 9-11), 33.2% of the specimens tested for influenza in the New England region*** were positive. Between 20.3% and 26.3% of specimens tested for influenza during the past 3 weeks in the Mountain, South Atlantic, and East North Central regions were positive, and between 12.9% and 17.0% of the specimens tested in the West North Central, Pacific, and West South Central regions were positive for influenza. In the Mid-Atlantic and East South Central regions, less than 10% of specimens tested for influenza during the past 3 weeks were positive.
Since September 29, WHO and NREVSS laboratories have tested a total of 66,695 specimens for influenza viruses and 7,624 (11.4%) were positive. Of the 7,624 viruses identified, 3,658 (48%) were influenza A viruses and 3,966 (52%) were influenza B viruses. However, during the past 3 weeks (weeks 9-11) influenza A viruses have been reported more frequently (63%) than influenza B viruses. One thousand five hundred and ten (41%) of the 3,658 influenza A viruses have been subtyped; 1,234 (82%) were influenza A (H1)?viruses and 267 (18%) were influenza A (H3N2) viruses. Influenza A viruses were reported more frequently than influenza B viruses (range 52% - 89%) in the New England, East North Central, Mountain, Pacific, and Mid-Atlantic regions, and influenza B viruses were reported more frequently than influenza A viruses (range 59% - 78%) in the West South Central, South Atlantic, West North Central, and East South Central regions. However, during the past 3 weeks (weeks 9-11), influenza A activity in the East South Central, West North Central, and West South Central regions has increased to the point that during those weeks, influenza A viruses were reported more frequently than influenza B viruses.
Antigenic Characterization of Viral Isolates:
CDC has antigenically characterized 330 influenza viruses submitted by U.S. laboratories since September 29: one hundred and twenty-six influenza A (H1)?viruses, 54 influenza A (H3N2) viruses, and 150 influenza B viruses. Forty-five of the influenza A (H1) viruses had the N1 neuraminidase, 20 had the N2 neuraminidase, and the neuraminidase typing for 61 H1 viruses is pending. The hemagglutinin proteins of all 126 influenza A (H1) viruses were similar antigenically to the hemagglutinin of the vaccine strain A/New Caledonia/20/99 (H1N1). Of the 54 influenza A (H3N2) isolates that have been characterized, 47 (87%) were similar to A/Panama/2007/99, the H3N2 component of the 2002-03 influenza vaccine, and 7 (13%) showed reduced titers to ferret antisera produced against A/Panama/2007/99. Of the 150 influenza B viruses that have been characterized, 149 belonged to the B/Victoria lineage and were similar antigenically to the vaccine strain B/Hong Kong/330/01 and one belonged to the B/Yamagata lineage and was similar to B/Shizuoka/15/01, a B/Sichuan/379/99-like virus.
Click here for more information about influenza A (H1N2) viruses
Pneumonia and Influenza (P&I) Mortality Surveillance:
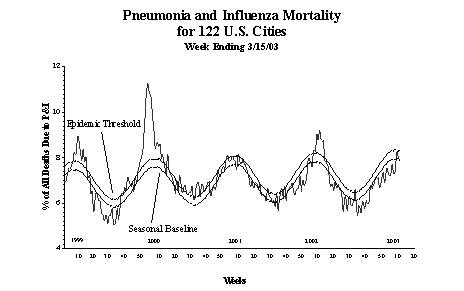
During week 11, the percentage of all deaths due to pneumonia and influenza as reported by the vital statistics offices of 122 U.S. cities was 7.8%. This percentage is below the epidemic threshold of 8.2% for week 11.
Influenza-like Illness Surveillance *:
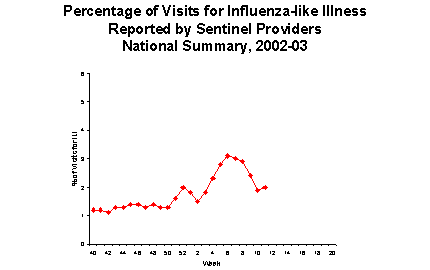
During week 11, 2.0% of patient visits to U.S. sentinel providers were due to ILI. This percentage is above the national baseline of 1.9%. On a regional level***, the percentage of visits for ILI ranged from 0.8% to 4.0%. Due to wide variability in regional level data, it is not appropriate to apply the national baseline to regional level data.
Influenza Activity as Assessed by State and Territorial Epidemiologists**:
Influenza activity was reported as widespread in 5 states (Alaska, Colorado, Montana, Tennessee, and Utah). Nineteen states reported regional activity, and 24 states, New York City, and Washington, D.C. reported sporadic influenza activity. One state reported no influenza activity and 1 state did not report.
* Reporting is incomplete for this week. Numbers may change
as more reports are received.
** Influenza activity is defined as influenza-like illness and/or culture-confirmed
influenza.
Includes both the A (H1N1) and A (H1N2) influenza virus subtypes. The influenza
A (H1N2) strain appears to have resulted from the reassortment of the genes of
currently circulating influenza A (H1N1) and A (H3N2) subtypes. Because the hemagglutinin
proteins of the A (H1N2) viruses are similar to those of the currently circulating
A (H1N1) viruses and the neuraminidase proteins are similar to those of the currently
circulating A (H3N2) viruses, the 2002-03 influenza vaccine should provide protection
against A (H1N2) viruses.
*** Surveillance Regions: New England (Connecticut, Maine,
Massachusetts, New Hampshire, Vermont, Rhode Island); Mid-Atlantic (New
Jersey, New York City, Pennsylvania, Upstate New York); East North
Central (Illinois, Indiana, Michigan, Ohio, Wisconsin); West
North Central (Iowa, Kansas, Minnesota, Missouri, Nebraska, North
Dakota, South Dakota); South Atlantic (Delaware, Florida,
Georgia, Maryland, North Carolina, South Carolina, Virginia, Washington, D.C.,
West Virginia); East South Central (Alabama, Kentucky, Mississippi,
Tennessee); West South Central (Arkansas, Louisiana, Oklahoma,
Texas); Mountain (Arizona, Colorado, Idaho, Montana, Nevada,
New Mexico, Utah, Wyoming); Pacific (Alaska, California, Hawaii,
Oregon, Washington)
Report prepared March 20, 2003
Error processing SSI file